Running a “well-oiled data machine” requires respecting the core mechanics that keep the machine from breaking down, even without a PhD in mathematics.
What is Statistical Significance?
In plain English, statistical significance represents your confidence level. It answers the question: “How likely is it that the difference we see is due to our change, rather than random chance?”
In the industry, we typically aim for a 95% confidence level ($p < 0.05$). Think of it like a legal trial.
- 95% Significance: We are 95% sure the Challenger variation is actually better than the Control. There is only a 5% chance that the lift we are seeing is a fluke.
Making business decisions based on 80% significance means accepting a 1-in-5 chance that you are wrong. Over the course of a year, that error rate compounds, leading to a “leaky bucket” in your revenue strategy.
Understanding the Null Hypothesis
The Null Hypothesis ($H_0$) represents the skepticism inherent in science. It is the presumption of innocence.
- The Null Hypothesis states: “This change made no difference. The conversion rates are the same.”
As marketers, our goal is to gather enough evidence to reject the null hypothesis. We assume nothing happened until the data screams otherwise. This mindset shift from “expecting a win” to “proving a win” is what separates elite growth teams from the rest.
Calculating Sample Size for Reliable Tests
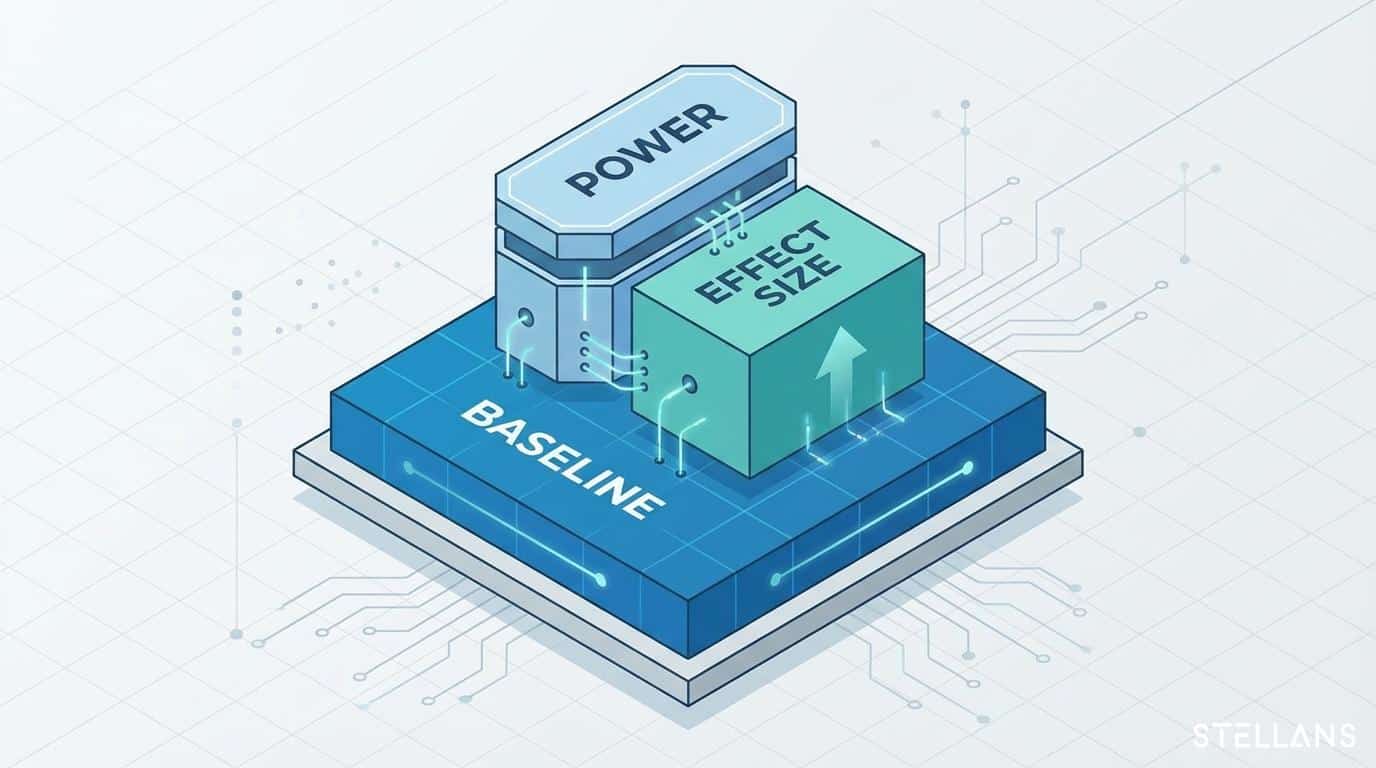
One of the most common questions we hear is, “How long should I run this test?” The answer relies on your sample size, which is dictated by three factors:
- Baseline Conversion Rate: How often people convert now.
- Minimum Detectable Effect (MDE): How big of a lift you want to detect.
- Statistical Power: Usually set to 80% (the ability to find a winner if one exists).
Low-traffic sites require a massive impact (high MDE) to prove success. High traffic sites allow you to detect smaller nuances.
Sample Size Estimates (Per Variation)
| Baseline Conversion Rate |
Desired Lift (MDE) |
Approx. Visitors Needed (Per Variation) |
| 5% |
20% |
3,100 |
| 5% |
10% |
12,200 |
| 5% |
5% |
48,000 |
| 2% |
20% |
7,600 |
| 2% |
5% |
120,000 |
Note: The lower your conversion rate and the smaller the impact you want to detect, the more traffic you need.
Attempting to detect a 5% lift on a page with only 1,000 visitors ensures your test is doomed before it begins.