Automating Your Weekly Business Review (WBR) for Faster Decisions

10 minutes to read
Get free consultation


The pace of modern business demands agile decision-making. As organizations expand operations across different markets, data generation accelerates at an unprecedented rate. Frequently, this operational data grows faster than leadership teams can intuitively digest and interpret it. Equipping decision makers with clear visibility into core metrics ensures growth continues to accelerate.

This is where automation unlocks true scalability. Today, a weekly business review must be more than a simple sync on a calendar. It needs to serve as the strategic engine for your company. Getting there requires reliable infrastructure. We work with you to unlock data potential, transforming disjointed records into a unified reporting system. Automating the weekly business review represents a massive leap forward into running a proactive, highly optimized business.

What is a Weekly Business Review and Why It Demands Automation

A weekly business review is a dedicated, recurring leadership meeting designed to monitor operational health. During this session, executives, department heads, and BI managers review specific performance indicators to detect anomalies and adjust strategies. In theory, this review creates alignment and rapid course correction.

Building an automated and reliable process ensures teams begin their meetings with absolute alignment.

Overcoming the Manual Reporting Trap

Optimizing the preparation phase unlocks the true value of a traditional weekly business review. Analysts and department leaders traditionally spend hours, and sometimes entire days, manually exporting data from various platforms. They copy and paste figures into massive spreadsheets, running fragile formulas to consolidate the numbers.

Automating reporting liberates your team from these manual chores. First, it reallocates valuable human capital to deep analysis rather than repetitive data tasks. Second, it secures your business against huge margins of human error. Ensuring precise data integrity gives you an accurate and clear performance picture.

Our goal is your immediate empowerment. By engineering automated dashboard reporting, we eliminate the friction of manual data preparation. Dashboards refresh instantly, capturing real-time progress. This automation elevates the weekly business review from a retroactive history lesson into a forward-looking strategy session. Your team regains the hours previously spent on data extraction, allowing them to focus entirely on actionable insights.

Defining Standard WBR Metrics That Move the Needle

To ensure your weekly business review generates value, leadership must agree on exactly what to measure. Standardizing these metrics is absolutely essential for consistent business performance tracking. Focusing on the most impactful data points empowers quick, decisive action. Success depends on isolating the metrics that actually drive business performance.

Distinguishing Input vs. Output Metrics

A highly effective review framework separates metrics into two distinct categories: input metrics and output metrics. Understanding the relationship between these two groups allows executives to pinpoint operational bottlenecks accurately.

Input metrics are the actionable behaviors and activities your team controls directly. They are leading indicators. If you adjust your input metrics effectively, the results will eventually manifest in your output metrics. Output metrics denote the ultimate results or business outcomes. They are lagging indicators. You can effectively drive results by focusing on and changing the input metrics that influence your outcomes.

Building Your WBR Template

A practical weekly business review requires a standardized template. This template must remain consistent across departments to foster absolute clarity. We help clients establish a foundational template that perfectly aligns input actions with output goals.

Input Metrics (Leading Indicators) Output Metrics (Lagging Indicators)
Sales calls completed per representative Quarterly recurring revenue recognized (QRR)
Qualified pipeline generated Total gross margin percentage
Feature adoption rate among active users Customer retention and total churn rate
Average response time for support tickets Net Promoter Score (NPS) and customer satisfaction
Supply chain fulfillment speed Total operating costs and expense ratios

Defining standard WBR metrics creates a shared language across the enterprise. When every leader adopts the same WBR template, the organization moves collectively toward unified targets.

Connecting Data Sources to Visualization for a Single Source of Truth

Creating a stunning interactive dashboard is just the final visible step in a much deeper engineering process. True automation demands the seamless integration of underlying data architecture. Many software vendors promise instant results through simple drag-and-drop interfaces. However, they consistently overlook the reality of fragmented enterprise tools.

Integrating Disparate Data with End-to-End DataOps

Your organization likely relies on varied platforms for sales execution, marketing automation, financial planning, and customer support. Creating robust pipelines allows these systems to communicate seamlessly with one another. To achieve automated dashboard reporting, you must build robust pipelines that bridge the gaps between siloed applications.

This requires expert DataOps engineering. The process involves systematically extracting raw information, transforming it into a standardized format, and loading it into a central data warehouse. This automated flow guarantees that the marketing team and the sales team draw performance indicators from the exact same dataset.

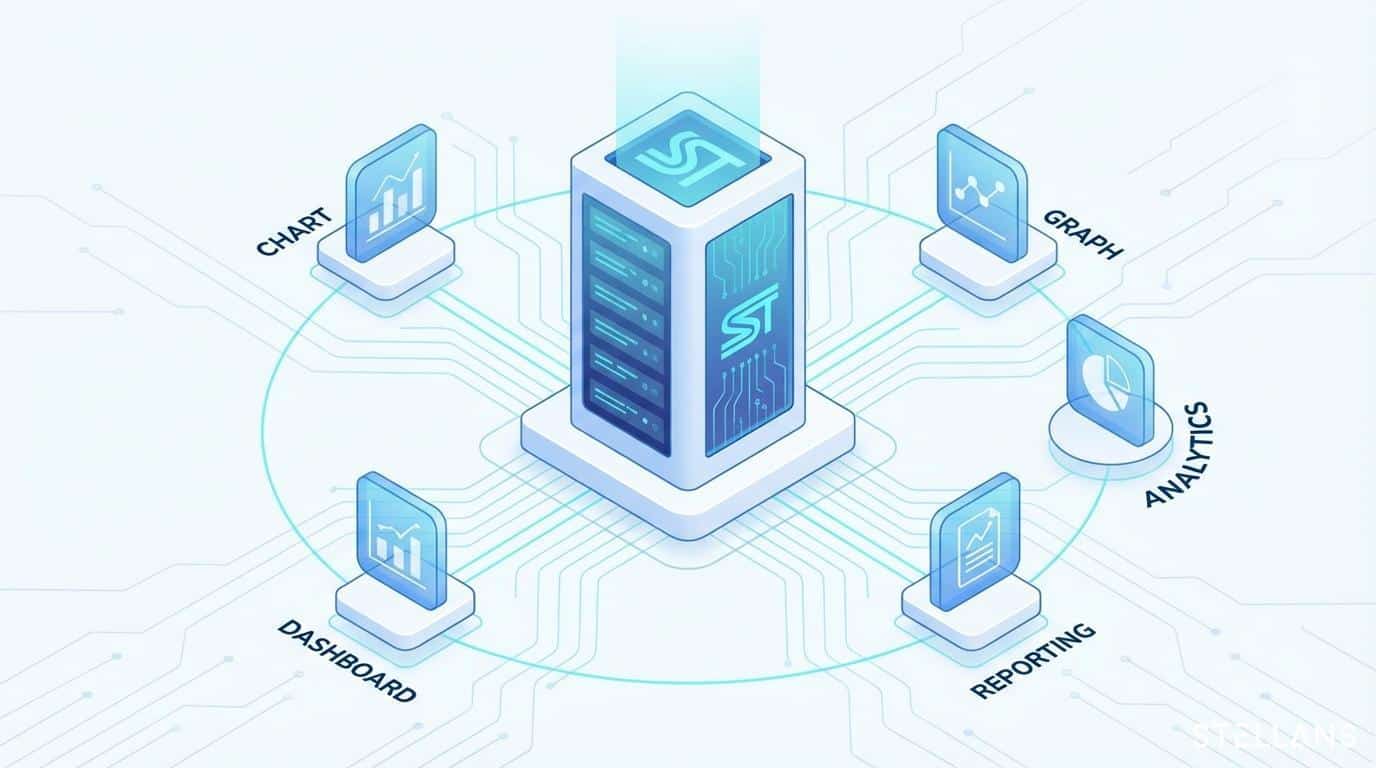
Here is the straightforward architecture we deploy to streamline the extraction process:

Ensuring Zero Data Discrepancies

Meeting transparency rests on absolute data trust. Bringing unified, single-source reports to the table ensures the meeting stays productive and focused. Establishing absolute trust in your numbers fosters productive discussions and strategic alignment among all stakeholders.

To guarantee this alignment, our data engineering approach ensures zero data discrepancies. By applying tools like Change Data Capture, data is synchronized incrementally in near real-time. If a record updates in your CRM, the change immediately reflects in the data warehouse. This process scales effortlessly, even when drawing from complex ecosystems. We specialize in building reliable infrastructure, including our comprehensive Business Intelligence solutions, to manage high-volume data without failure. With a unified data pipeline, the numbers are absolutely undisputed.

The Cultural Shift: Running Data-First Meetings

Combining robust technology with a profound cultural shift solves complex behavioral challenges. Transitioning from subjective spreadsheets to automated dashboards empowers your enterprise to operate at its peak. Leadership must champion a framework that prioritizes objectivity and accountability above all else.

Eliminating Meeting Inefficiency

By embracing data-first methods, executives save the first forty minutes of a one-hour weekly business review that would otherwise be spent verifying data. Operations might show a surge in fulfillment, while finance shows a dip in recognized revenue. Maximizing meeting efficiency ensures high-level strategy remains the priority and strategic resource optimization becomes the norm.

Data-first meetings solve this dynamic instantly. When the automated dashboard acts as the sole source of truth, teams immediately align. Leaders log in, view the standardized metrics, and accept the objective reality of the business. The conversation actively pivots toward identifying the actions that will accelerate positive trends. This drastic reduction in meeting inefficiency liberates leaders to actually lead.

Driving Accountability Across Teams

Cultivating a resilient enterprise requires an absolute shift to data-first meetings. In this environment, teams thrive by adopting objective data points and retiring subjective status updates. Precise updates replace vague summaries, allowing teams to proudly report how pipeline generation increased against the moving average.

When performance opportunities appear on the dashboard, the corresponding department head clarifies the root cause and proposes a tactical strategy based on the input metrics. This process fosters an environment of shared problem solving and collaborative growth. We guide clients through this organizational transformation, ensuring both executives and BI managers adopt the new behavioral expectations smoothly.

Case Study: Resolving Reporting Chaos for High-Growth Scaling

Automated reporting becomes incredibly valuable when scaling across international markets. Recently, we partnered with a rapidly expanding brand that relied on fragmented spreadsheets across seven different regions. Leadership gained essential global perspective by transforming their data into a coherent global view, giving them clear visibility into their expanding operations.

85+ Sources, Zero Downtime

When the client came to us, they wanted to streamline their extensive data landscape. They were pulling critical business information from dozens of disconnected platforms. To optimize this, we engineered a scalable, reliable pipeline. We seamlessly integrated 85+ disparate sources into a centralized data warehouse leveraging advanced change data capture methodologies.

The technical execution required strict adherence to DataOps principles, ensuring zero downtime during the migration. Our focus remained on delivering a robust backend that could support interactive BI dashboards easily. By automating the extraction layer, the client transitioned fully to immediate dashboard reporting.

The outcomes redefined their leadership cadence. The executive team achieved 40% faster insights, reclaiming hundreds of hours previously spent on data reconciliation. Furthermore, by implementing advanced predictive models alongside their standard weekly business review metrics, they achieved 85%+ predictive accuracy on future revenue run rates. You can explore the technical nuances of this specific rollout in our detailed WBR Implementation Case Study.

Take the Next Step in Business Intelligence

The evolution of the weekly business review is undeniable. Adopting an automated data machine gives your organization a distinct competitive advantage. True growth builds upon a well-oiled data machine: one that integrates disparate sources seamlessly, ensures complete numerical alignment, and establishes a single source of truth for all leadership decisions.

We serve as your technical translator and empowering partner, elevating your business toward automated clarity. Our team engineers the backend architecture, develops the front-end visual dashboards, and supports the cultural transformation required for absolute accountability. By automating your core business performance tracking, we give your leadership the bandwidth needed to make proactive, highly strategic decisions.

If your team is ready to modernize reporting, consolidate your intelligence, or explore AI solutions tailored to real business needs, we are ready to build the robust infrastructure. Let us turn your complex data structures into clear, immediate advantages. Contact our experts today to begin your transformation. Visit our About Us page to learn how our dedicated consulting and engineering teams can fuel your growth.

Frequently Asked Questions

What is a Weekly Business Review (WBR)?
A Weekly Business Review (WBR) is a strategic leadership meeting where executives and teams evaluate standardized metrics and KPIs to monitor business performance, drive accountability, and make fast, agile course corrections.

How does automated dashboard reporting improve a WBR?
Automated dashboard reporting accelerates workflows by seamlessly integrating data across sources. It extracts data from multiple platforms in real time, guaranteeing data alignment and empowering teams to dedicate their energy to proactive decision-making.

What cultural shift is needed for a data-first WBR?
Organizations thrive by embracing data-first meetings. This requires a culture where single-source-of-truth automated dashboards are deeply trusted, and leaders are accountable for objective input and output metrics.

References

Article By:

https://stellans.io/wp-content/uploads/2026/01/1723232006354-1.jpg
Roman Sterjanov

Data Analyst

Related Posts

    Get a Free Data Audit

    * You can attach up to 3 files, each up to 3MB, in doc, docx, pdf, ppt, or pptx format.