How to Calculate Customer Lifetime Value: Formulas, Templates & Examples

10 minutes to read
Get free consultation


Customer Lifetime Value sets the financial heartbeat of your business. We understand how to empower you to scale effectively. You need clear visibility into your customer profitability. Global leaders clearly support this focus. For example, McKinsey’s research on Customer Lifetime Value as the customer compass highlights its massive impact.

We will break down exactly how to run these numbers manually. We provide you with the exact spreadsheet frameworks you need today. These tools solve your immediate tracking priorities. Adopting automated tracking ultimately unlocks your true growth potential. We will also show you a better way. AI-led predictions solve your long-term scaling goals completely.

What is Customer Lifetime Value (CLV)?

Customer Lifetime Value measures your expected total revenue from a single customer throughout their relationship with your brand. We consider this metric absolutely critical. It reveals the true health of your operations.

Tracking this metric accurately ensures your LTV comfortably exceeds your Customer Acquisition Cost (CAC). You gain a crystal clear ROI. You generate significantly more margin from clients in the long run than what you spend to acquire them. This dynamic creates massive financial momentum.

We view accurate metric architecture as the foundation of any resilient data pipeline. You need a reliable data aggregation system to thrive. Our platform acts as a well-oiled data machine. We streamline your disconnected data sources. We turn them into unified, actionable insights. We empower you to grow confidently.

Step-by-Step CLV Calculation Formulas

We want to simplify the math for you. You can calculate these metrics manually. Here is how we structure both standard and advanced methodologies. You can compare our methodology against Forrester’s customer lifetime value calculation methodology for further industry validation.

Step 1: Execute The Historic CLV Formula

Historic measurement looks at past purchase data exclusively. We multiply three core numbers to find this baseline.

Historic Gross CLV = (Average Order Value) x (Purchase Frequency) x (Customer Lifespan)

Let us look at a quick eCommerce example. Your average customer spends $50 per order. They buy from you 4 times a year. They stay loyal for 3 years. Your calculation is: 50 x 4 x 3. Your Historic Gross CLV equals $600.

This formula provides a basic business baseline. It relies reliably on static past data to establish its starting point.

Step 2: Implement The Predictive CLV Formula Using Machine Learning

Expanding your strategic vision requires building predictive models to forecast future behavioral patterns. Machine learning tools evaluate proactive engagement signals. AI systems calculate discounted cash flows dynamically. We actively interpret ongoing behaviors alongside past receipts.

Our predictive engines analyze micro-interactions seamlessly. They spot when a customer engages frequently with emails. They note when application login frequency increases. We use this behavioral data to predict an individual’s future value reliably. This pipeline updates in real time. We empower your team to nurture a high-value customer long before they consider churning.

Step 3: Factor in Customer Acquisition Cost (CAC)

You must always account for your acquisition costs. True profitability becomes remarkably clear through this exact step. Smart budget allocations start right here.

Net CLV = Gross CLV – CAC

You must include all marketing and sales expenses in your CAC. You must also include all onboarding costs. If your Gross CLV is $600 and your CAC is $200, your Net CLV is $400. We encourage our clients to track this ratio obsessively.

Downloadable CLV Calculation Templates for Excel & Google Sheets

We want to fulfill your immediate tracking needs. You can copy our exact calculation framework directly into your preferred spreadsheet software.

Set up your columns exactly like the layout mapped below:

Column A: Customer ID (Your unique database identifier)
Column B: Total Revenue (The sum of all lifetime purchases)
Column C: Number of Purchases (The total count of transactions)
Column D: First Purchase Date (The start of the customer lifespan)
Column E: Last Purchase Date (The current end of the lifespan)
Column F: Average Order Value [Formula: Column B / Column C]
Column G: Purchase Frequency [Formula: Column C / Active Years]
Column H: CAC (Fully attributed marketing and sales spend)
Column I: Gross CLV [Formula: Column F x Column G x Active Years]
Column J: Net CLV [Formula: Column I - Column H]

You can paste these headers into a blank workbook today. You can populate the rows with your CRM exports quickly. We recommend updating this sheet weekly to maintain data integrity.

Industry Benchmarks for Customer Lifetime Value

You need to know how you compare to the open market. We compiled the standard targets for modern digital businesses. We align our consulting benchmarks with these target ratios.

eCommerce & DTC CLV Benchmarks

E-commerce businesses typically pursue efficient scaling. A strong Direct-to-Consumer business requires strict acquisition discipline. Your LTV to CAC ratio should sit firmly around 3:1.

Metric Profile Expected LTV:CAC Ratio Business Health Status
Building Phase 1:1 or lower You focus entirely on expanding your acquisition strategies.
Growing 2:1 You maintain operations while gearing up to scale.
Strong Benchmark 3:1 You generate sustainable, profitable growth.

Maintaining this 3:1 benchmark permanently ensures true business momentum. You must optimize your retention strategy continually to achieve this.

SaaS CLV Benchmarks

Software-as-a-Service companies thrive on recurring subscription revenue. Your metric targets reflect higher values than retail. B2B software vendors maintain robust margins to fund aggressive product development.

You should follow the standard SaaS rule of thumb that LTV/CAC should be 3.0 or higher. Many of our top-performing SaaS clients routinely push this ratio to 4:1. We analyze Annual Recurring Revenue (ARR) carefully to calculate these figures for you reliably.

Using Real-Time CLV for Smarter Budget Allocation

Transitioning to automated systems ensures your data stays perfectly up to date. We provide this exact advantage. We implement robust automated reporting ecosystems. Our bespoke LTV Prediction & BI Reporting solutions centralize your tracking entirely.

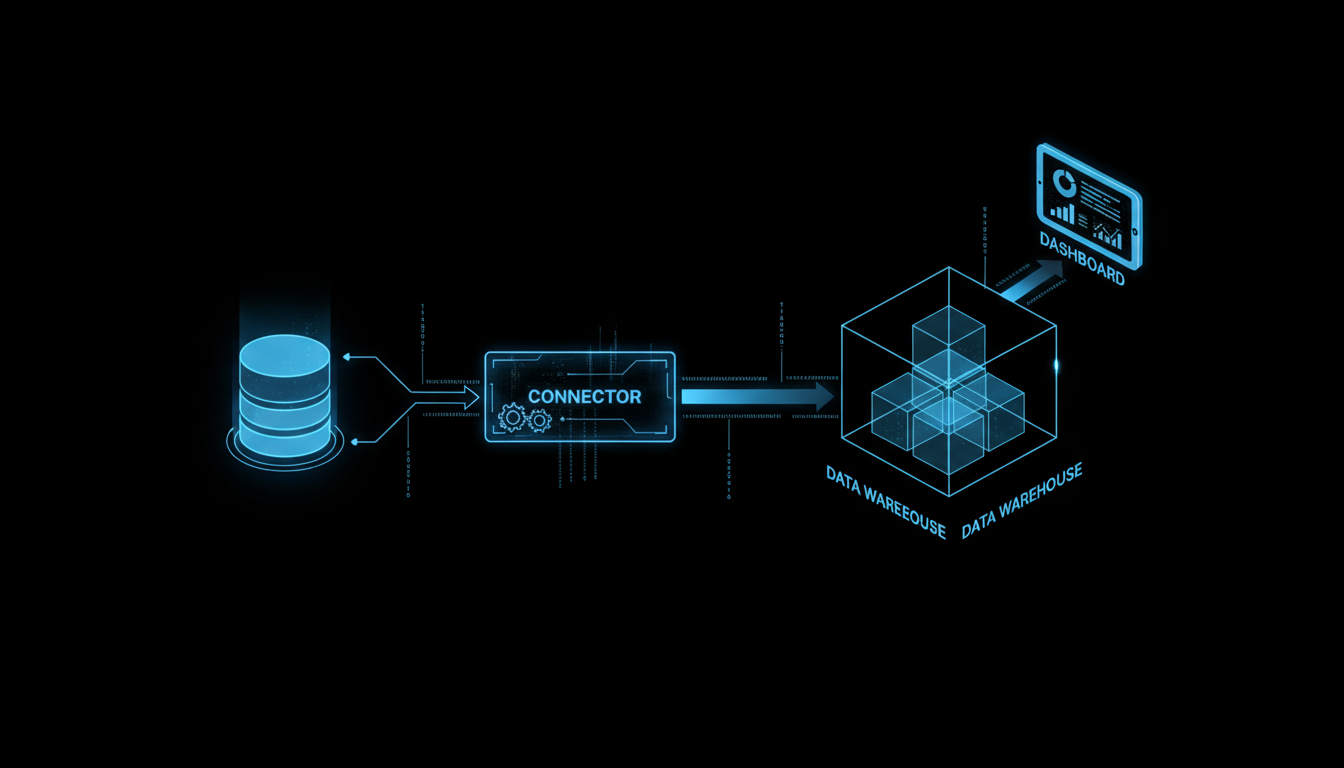
We employ Change Data Capture (CDC) technology daily. This technical tool identifies database updates instantly. It streams those changes straight into your data warehouse. Our data pipeline acts as a high-speed highway. You get sub-minute data flows constantly.

Your analysts can reallocate budgets toward successful ad campaigns instantly. They can accelerate top-performing channels continuously. We use dbt to ensure error-free reporting. These tools perfectly align your marketing reaction with live customer actions.

Case Studies: Optimizing CAC and ROI with Predictive CLV

We let our client outcomes speak first. We recently partnered with a rapidly growing SaaS provider. They aimed to unify their data spread across 85 different tools. Their marketing teams sought clearer visibility to maximize their budget efficiently.

We engineered a centralized AI pipeline for them. We utilized Fivetran to centralize all 85 isolated data streams. We connected this data directly to Looker. We deployed a predictive machine-learning model internally. This exact system mapped future subscription renewals automatically.

Our client visualized their predictive LTV effortlessly. They completely optimized their budget allocation within two short months. Clients report 40% faster insights post-implementation. We empower our clients to make smarter financial decisions every single day.

Common Mistakes When Calculating CLV and How to Avoid Them

We actively guide incoming businesses toward highly accurate analytical practices. You must embrace these three essential strategies to succeed.

First, companies achieve better results by embracing fluctuating retention rates. Customer loyalty evolves naturally over time. You must treat retention as an adaptable standard.

Second, organizations benefit greatly from unifying isolated CRM data. You must centralize your data sources aggressively. Unified analytics lead to brilliant strategic masterstrokes.

Third, leaders succeed by adopting predictive mapping alongside historic tracking. Forward-looking models guarantee informed future strategies.

We strongly suggest that you audit your budget allocation to implement these specific improvements. We work with you to unlock your data potential seamlessly.

Conclusion

Customer Lifetime Value actively dictates your ultimate business success. You now have the formulas and templates to start measuring this vital number today. Upgrading to automated data pipelines will accelerate your progress tremendously. Your industry competitors are already leveraging dynamic platforms to win.

We invite you to discover what is truly possible with modern intelligence. Let us build your centralized reporting architecture correctly. Visit Stellans to elevate your data strategy today. We will transform your insight generation process completely. Our goal: your growth.

Frequently Asked Questions About CLV Calculation

What is the difference between predictive and historic CLV calculation? Historic calculation uses past purchase data to evaluate customer value. Predictive calculation uses machine learning to forecast future spending behaviors. We consider predictive modeling immensely powerful for scaling businesses.

How do you use CLV to optimize marketing spend? You use this exact metric to establish profitable parameters on your acquisition costs. You identify your most profitable customer segments rapidly. You then route your ad budget exclusively toward acquiring those high-value demographics.

Are there free templates for CLV calculation? Yes, we provided a free spreadsheet layout earlier in this technical guide. You can copy our exact column structure into any standard spreadsheet tool. This method gives you a fast, immediate starting point.

References

  1. McKinsey’s research on Customer Lifetime Value as the customer compass
  2. Forrester’s customer lifetime value calculation methodology
  3. SaaS rule of thumb that LTV/CAC should be 3.0 or higher

Article By:

https://stellans.io/wp-content/uploads/2026/01/1565080602204-1.jpeg
Zhenya Matus

Fractional CDO

Related Posts

    Get a Free Data Audit

    * You can attach up to 3 files, each up to 3MB, in doc, docx, pdf, ppt, or pptx format.