SaaS Marketing Funnel Metrics Glossary: CAC, LTV, Churn

15 minutes to read
Get free consultation


Growth teams at SaaS companies face a common challenge: too many leads, not enough time, and no clear way to prioritize. Without data-driven scoring, sales reps waste hours chasing prospects who never convert while high-intent buyers slip through the cracks.

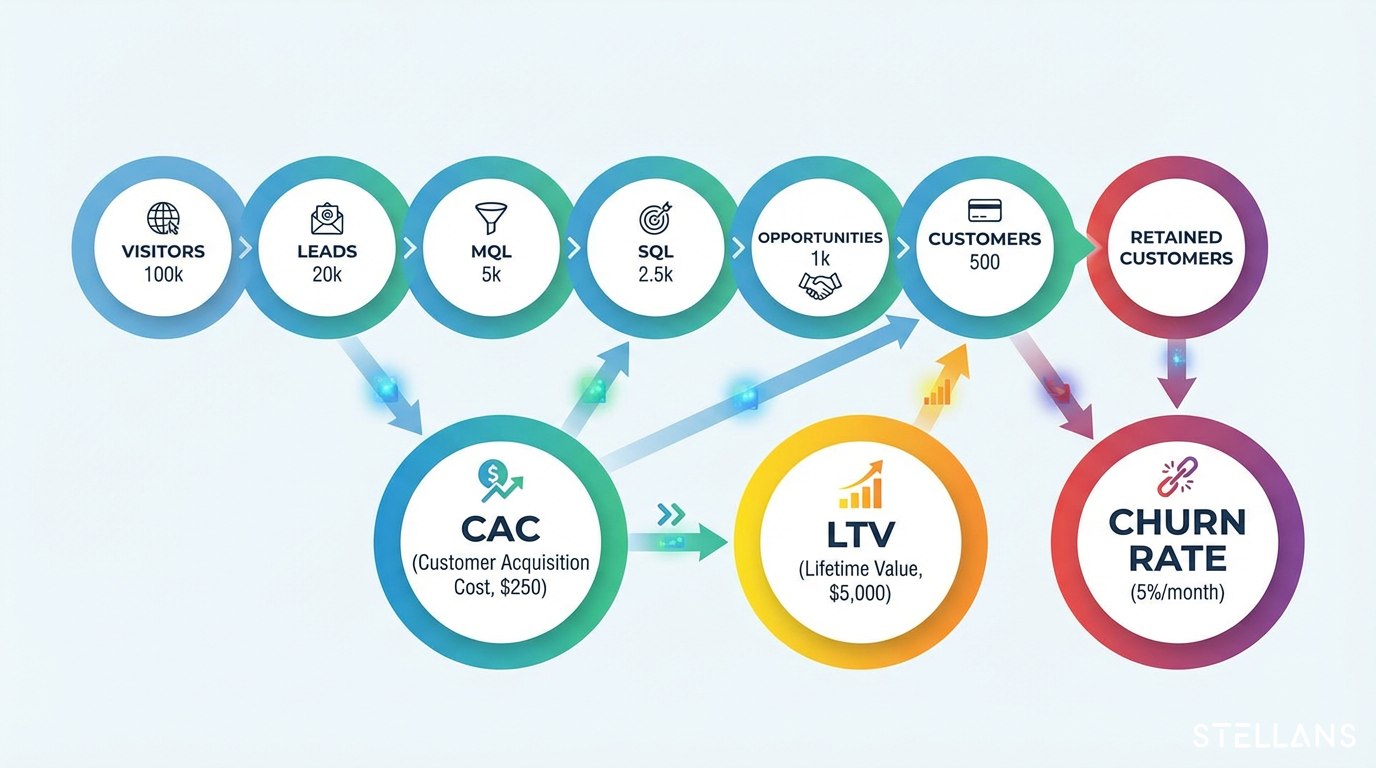
The solution lies in understanding your funnel metrics and building predictive lead-scoring models that surface conversion probability for every prospect. Customer Acquisition Cost (CAC), Customer Lifetime Value (LTV), and churn rate form the foundation of this approach. These metrics do more than measure business health. They inform the features you build into your scoring models.

In this guide, we walk through both the theory and the hands-on implementation. You will learn how CAC, LTV, and churn definitions translate into actionable model features. Then, we cover the complete pipeline: SQL data extraction, dbt feature engineering, Python model training with scikit-learn, and productionizing scores back to your data warehouse.

This knowledge comes from our work with marketing analytics teams, growth strategists, and technical specialists who need their data stack to drive real results.

SaaS Marketing Funnel Metrics Glossary

Before building any predictive model, you need to understand the metrics that define success. These three KPIs should guide both your business strategy and your feature engineering decisions.

Customer Acquisition Cost (CAC)

Definition: CAC measures the total cost of acquiring a new customer. The formula is straightforward:

CAC = Total Sales & Marketing Spend / New Customers Acquired

For example, if your company spent $100,000 on sales and marketing in Q1 and acquired 50 new customers, your CAC is $2,000.

2026 Benchmark: Healthy SaaS companies target a CAC payback period under 12 months. This means the gross margin from a customer should recover acquisition costs within the first year.

How CAC Informs Lead Scoring: Leads acquired through lower-cost channels (organic search, referrals) typically signal higher intent and lower risk. In your feature engineering, you can include the acquisition channel as a scoring variable. A lead from a paid campaign with a historically high CAC might score lower than one from organic search, all else being equal.

The U.S. Small Business Administration emphasizes reviewing customer acquisition costs regularly to determine the cost of drawing in each customer and converting those leads to sales.

Customer Lifetime Value (LTV)

Definition: LTV represents the total revenue you can expect from a customer over the entire relationship. A common formula:

LTV = Average Revenue per Customer × Gross Margin × Average Customer Lifespan

More sophisticated calculations account for discount rates and variable retention curves. MIT Sloan Management Review research on customer lifetime value recommends comparing the CLV of a prospective customer to their estimated acquisition cost before investing in acquisition.

2026 Benchmark: Target an LTV: CAC ratio greater than 3:1. If your lifetime value is three times your acquisition cost, your unit economics are sustainable. Ratios below 3:1 sustained over time indicate you are overpaying to acquire customers.

How LTV Informs Lead Scoring: High-LTV potential should increase lead scores. Features like company size, industry vertical, and initial product interest can predict future expansion revenue. A lead from an enterprise company with a history of large contracts should score higher than a small business prospect, assuming your model learns this pattern from historical data.

Churn Rate

Definition: Churn rate measures the percentage of customers who stop using your product in a given period:

Churn Rate = (Customers Lost in Period / Customers at Start) × 100

2026 Benchmark: Healthy SaaS companies maintain monthly churn rates below 5%. Annual churn under 10% is excellent for enterprise products.

How Churn Informs Lead Scoring: Churn signals serve as negative scoring features. If leads from certain segments or acquisition channels show historically high churn rates, your model should penalize those characteristics. The goal is conversion to retained, profitable customers.

Metric Formula 2026 Benchmark
CAC Sales & Marketing Spend / New Customers Payback < 12 months
LTV Revenue × Margin × Lifespan LTV:CAC > 3:1
Churn (Lost Customers / Start Customers) × 100 < 5% monthly

Why Predictive Lead Scoring Matters for Growth Teams

Traditional lead scoring relies on manual rules: assign 10 points for downloading a whitepaper, 20 points for requesting a demo, and deduct 5 points for a free email domain. These arbitrary values reflect intuition rather than data.

Predictive lead scoring uses machine learning algorithms to analyze historical conversion data and automatically identify patterns across dozens of variables. Instead of arbitrary point values, the model outputs a probability score representing how likely each lead is to convert.

The business impact is substantial:

Research from Harvard Business School on startup performance found that startups with high confidence in their LTV/CAC estimates saw the predicted probability of low valuation drop from 18% to just 2%. Understanding and operationalizing these metrics directly correlates with company success.

Building Predictive Lead Scoring Models: Step-by-Step

Now we move from theory to implementation. This section provides executable code from data extraction through production deployment.

Step 1: Data Extraction with SQL

Your source data likely spans multiple systems: CRM records, product usage events, marketing engagement data, and demographic information. The first step consolidates these into a single analytical dataset.

Here is an example SQL query extracting lead features from CRM and product usage tables:

-- Extract lead features for scoring model
SELECT 
    l.lead_id,
    l.created_at,
    l.source_channel,
    l.company_size,
    l.industry,
    -- Engagement metrics
    COUNT(DISTINCT e.email_open_id) AS email_opens,
    COUNT(DISTINCT e.email_click_id) AS email_clicks,
    COUNT(DISTINCT p.page_view_id) AS page_views,
    COUNT(DISTINCT d.demo_request_id) AS demo_requests,
    -- Recency
    DATEDIFF('day', MAX(e.event_timestamp), CURRENT_DATE()) AS days_since_last_email_engagement,
    DATEDIFF('day', MAX(p.page_view_timestamp), CURRENT_DATE()) AS days_since_last_page_view,
    -- Outcome label
    CASE WHEN c.customer_id IS NOT NULL THEN 1 ELSE 0 END AS converted
FROM leads l
LEFT JOIN email_events e ON l.lead_id = e.lead_id
LEFT JOIN page_views p ON l.lead_id = p.lead_id  
LEFT JOIN demo_requests d ON l.lead_id = d.lead_id
LEFT JOIN customers c ON l.lead_id = c.original_lead_id
WHERE l.created_at >= DATEADD('month', -12, CURRENT_DATE())
GROUP BY 
    l.lead_id,
    l.created_at,
    l.source_channel,
    l.company_size,
    l.industry,
    c.customer_id


This query joins lead records with engagement events and labels each lead based on whether they eventually converted to a customer.

Step 2: Feature Engineering with dbt

Raw data requires transformation before model training. DBT (data build tool) provides a structured approach to feature engineering that is versioned, tested, and documented.

Create a dbt model for lead feature transformation. First, define the model in your

models/marts/lead_scoring/ directory:

-- models/marts/lead_scoring/fct_lead_features.sql
{{ config(materialized='table') }}

WITH engagement_metrics AS (
    SELECT
        lead_id,
        COUNT(DISTINCT email_open_id) AS num_email_opens,
        COUNT(DISTINCT site_session_id) AS num_site_sessions,
        MAX(last_activity_at) AS last_engaged_at,
        -- Recency score: exponential decay from last activity
        EXP(
            -DATEDIFF('day', MAX(last_activity_at), CURRENT_DATE()) / 14.0
        ) AS recency_score
    FROM {{ ref('stg_lead_activities') }}
    GROUP BY lead_id
),

demographic_features AS (
    SELECT
        lead_id,
        CASE 
            WHEN company_size >= 1000 THEN 'enterprise'
            WHEN company_size >= 100 THEN 'mid_market'
            ELSE 'smb'
        END AS company_segment,
        industry
    FROM {{ ref('stg_leads') }}
)

SELECT
    d.lead_id,
    d.company_segment,
    d.industry,
    COALESCE(e.num_email_opens, 0) AS num_email_opens,
    COALESCE(e.num_site_sessions, 0) AS num_site_sessions,
    COALESCE(e.recency_score, 0) AS recency_score
FROM demographic_features d
LEFT JOIN engagement_metrics e ON d.lead_id = e.lead_id

Add schema tests to validate data quality:

# models/marts/lead_scoring/schema.yml
version: 2

models:
  - name: fct_lead_features
    description: Engineered features for lead scoring model
    columns:
      - name: lead_id
        tests:
          - not_null
          - unique
      - name: recency_score
        tests:
          - not_null
      - name: company_segment
        tests:
          - accepted_values:
              values: ['enterprise', 'mid_market', 'smb']

This approach follows dbt project structure conventions that ensure maintainability as your analytics codebase grows. For more on dbt Python models, refer to the dbt Python models guide.

Step 3: Training a Logistic Regression Model in Python

Logistic regression is an excellent starting point for lead scoring because it outputs interpretable probability scores and handles the binary classification task naturally.

Here is a complete Python script using scikit-learn:

import pandas as pd
import numpy as np
from sklearn.linear_model import LogisticRegression
from sklearn.model_selection import train_test_split
from sklearn.preprocessing import StandardScaler, OneHotEncoder
from sklearn.compose import ColumnTransformer
from sklearn.pipeline import Pipeline
from sklearn.metrics import roc_auc_score, precision_score, recall_score
import joblib

# Load engineered features from warehouse export
df = pd.read_csv('lead_features.csv')

# Define feature columns
numeric_features = ['num_email_opens', 'num_site_sessions', 'recency_score']
categorical_features = ['company_segment', 'industry']

X = df[numeric_features + categorical_features]
y = df['converted']

# Train/test split
X_train, X_test, y_train, y_test = train_test_split(
    X, y, test_size=0.2, random_state=42, stratify=y
)

# Preprocessing pipeline
preprocessor = ColumnTransformer(
    transformers=[
        ('num', StandardScaler(), numeric_features),
        ('cat', OneHotEncoder(handle_unknown='ignore'), categorical_features)
    ]
)

# Full pipeline with logistic regression
model_pipeline = Pipeline([
    ('preprocessor', preprocessor),
    ('classifier', LogisticRegression(
        C=1.0,
        class_weight='balanced',
        max_iter=1000,
        random_state=42
    ))
])

# Train the model
model_pipeline.fit(X_train, y_train)

# Generate predictions
y_pred_proba = model_pipeline.predict_proba(X_test)[:, 1]
y_pred = model_pipeline.predict(X_test)

# Evaluate model performance
auc = roc_auc_score(y_test, y_pred_proba)
precision = precision_score(y_test, y_pred)
recall = recall_score(y_test, y_pred)

print(f'AUC: {auc:.3f}')
print(f'Precision: {precision:.3f}')
print(f'Recall: {recall:.3f}')

# Target: AUC >= 0.70 for production deployment

# Save model for batch scoring
joblib.dump(model_pipeline, 'lead_scoring_model.joblib')

For detailed documentation on logistic regression parameters, see the scikit-learn LogisticRegression documentation.

Model Evaluation Guidance:

Step 4: Productionizing Your Lead Scores

The critical “last mile” is writing scores back to your data warehouse, where they can flow into CRM systems, marketing automation, and BI dashboards.

First, batch score all active leads:

import datetime
import pandas as pd
import joblib

# Load trained model
model_pipeline = joblib.load('lead_scoring_model.joblib')

# Load current leads requiring scores
current_leads = pd.read_csv('current_leads_features.csv')

# Generate probability scores
current_leads['score'] = model_pipeline.predict_proba(
    current_leads[numeric_features + categorical_features]
)[:, 1]

current_leads['scored_at'] = datetime.datetime.utcnow()
current_leads['model_version'] = 'v1.0'

# Export for warehouse load
current_leads[['lead_id', 'score', 'scored_at', 'model_version']].to_csv(
    'lead_scores_export.csv', 
    index=False
)

Then use a SQL MERGE pattern to update scores incrementally in your warehouse:

-- Warehouse MERGE statement (Snowflake/BigQuery compatible)
MERGE INTO lead_scores AS target
USING incoming_scores AS source
ON target.lead_id = source.lead_id

WHEN MATCHED THEN
    UPDATE SET 
        target.score = source.score,
        target.scored_at = source.scored_at,
        target.model_version = source.model_version,
        target.is_current = TRUE

WHEN NOT MATCHED THEN
    INSERT (lead_id, score, scored_at, model_version, is_current)
    VALUES (source.lead_id, source.score, source.scored_at, source.model_version, TRUE);

Orchestration Considerations:

SaaS Benchmarks and Best Practices

Key Performance Targets for 2026

Metric Benchmark Notes
CAC Payback < 12 months Recover acquisition cost within first year
LTV:CAC Ratio > 3:1 Sustainable unit economics threshold
Monthly Churn < 5% Healthy retention for B2B SaaS
Net Revenue Retention > 100% Expansion revenue offsets churn
Lead Scoring AUC >= 0.70 Minimum threshold for production models

Model Retraining Frequency:

How Stellans Bridges Data Engineering and Data Science for Marketing

We work with growth teams to operationalize the complete pipeline described in this guide. Our approach combines SQL/dbt foundation with Python modeling expertise, delivered through a partnership model that transfers knowledge to your team.

Our LTV Prediction and BI Reporting project demonstrates how we help clients build sustainable analytics capabilities. The focus is always on measurable outcomes: faster lead response, fewer pipeline surprises, and data decisions aligned to revenue.

Explore our full range of data consulting services or review additional client case studies to see our approach in action.

Conclusion

Predictive lead scoring transforms how growth teams prioritize their pipeline. By grounding your approach in CAC, LTV, and churn metrics, you ensure the model optimizes for sustainable revenue rather than vanity conversions.

The technical implementation requires bridging data engineering and data science: SQL for extraction, dbt for feature engineering, Python for modeling, and a robust write-back process for production deployment. Each component must work together reliably.

Ready to operationalize lead scoring with confidence? Contact Stellans to review your pipeline and discuss implementation support.

Frequently Asked Questions

What is predictive lead scoring, and how does it differ from traditional scoring?

Predictive lead scoring uses machine learning algorithms to analyze historical data and predict conversion likelihood, assigning probability scores rather than arbitrary point values. Unlike traditional rule-based scoring that relies on manual criteria, predictive models automatically identify patterns across dozens of variables to surface high-intent leads.

How do you calculate CAC for a SaaS business?

CAC is calculated by dividing total sales and marketing spend by the number of new customers acquired in a given period. For example, if you spent $100,000 on sales and marketing in Q1 and acquired 50 new customers, your CAC is $2,000. The 2026 benchmark targets CAC payback under 12 months.

Can SQL and Python work together in a lead scoring pipeline?

Yes, SQL and Python complement each other in lead scoring workflows. SQL handles data extraction and feature engineering through tools like dbt, while Python with libraries like scikit-learn trains and applies machine learning models. The scores can then be written back to the data warehouse using dbt incremental models or SQL MERGE patterns.

How often should you retrain a lead scoring model?

Lead scoring models should be retrained quarterly at a minimum, or when you observe significant changes in conversion patterns, market conditions, or product offerings. Monitor model accuracy metrics like AUC and precision weekly, and trigger retraining if performance degrades by more than 10%.

What benchmarks should SaaS companies target for LTV: CAC ratio?

Healthy SaaS companies target an LTV: CAC ratio greater than 3:1, meaning the lifetime value of a customer should be at least three times the cost to acquire them. Early-stage companies may operate at lower ratios while scaling, but sustained ratios below 3:1 indicate unsustainable unit economics.

References


Article By:

https://stellans.io/wp-content/uploads/2026/01/1723232006354-1.jpg
Roman Sterjanov,

Data Analyst

Related Posts

    Get a Free Data Audit

    * You can attach up to 3 files, each up to 3MB, in doc, docx, pdf, ppt, or pptx format.