Demand Forecasting: A Practical Guide for Supply Chain Management

9 minutes to read
Get free consultation

Introduction

Visualizing a perfectly balanced warehouse is the goal: your best-sellers are always in stock, and inventory moves efficiently. This ideal scenario allows supply chain managers to sleep soundly, contrasting with the nightmare of the “Inventory Paradox” where shelves overflow with stagnant products while popular items are missing.

Success in this industry requires managing high stakes. Industry data suggests that stockouts and missed sales opportunities cost retailers and manufacturers an estimated $1 trillion annually. Optimizing valid inventory saves working capital, which is money that could be fueled into growth rather than gathering dust on a pallet.

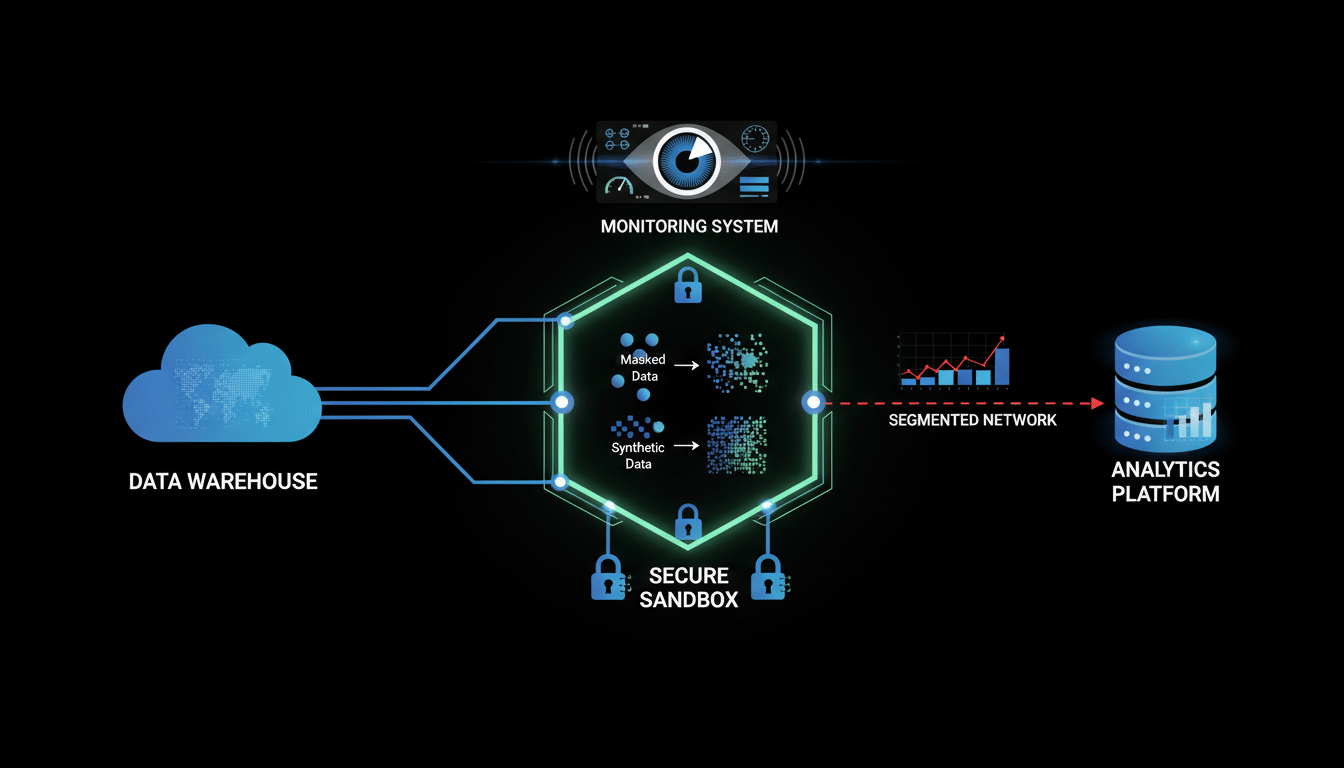
At Stellans, we believe that accurate forecasting isn’t magic; it is engineering. Building a robust data pipeline transforms raw historical data into a competitive advantage, rather than relying on a crystal ball. While many businesses rely on gut feeling or basic spreadsheets, leading organizations deploy advanced data science engines to predict the future with precision.

This guide moves beyond the basics. We map the journey from simple estimation to building a custom, high-performance demand forecasting engine using modern tools like Snowflakedbt, and Facebook Prophet.

What is Demand Forecasting & Why It’s the Pulse of Supply Chain

Demand forecasting is the systematic process of using historical sales data to predict future customer demand. It serves as the heartbeat of your supply chain and informs every decision from raw material procurement to warehouse staffing.

Distinguishing between strategic and tactical forecasting is critical, as they serve different masters:

The Bullwhip Effect

Consistent accuracy serves as your primary defense against the “Bullwhip Effect.” This phenomenon occurs when small fluctuations in retail demand cause progressively larger fluctuations in demand at the wholesale, distributor, and manufacturer levels. A 5% error in your forecast can ripple upstream to create a 40% swing in production, leading to massive waste and inefficiency.

The High Cost of Getting It Wrong: Stockouts vs. Excess Inventory

Accurate forecasting protects your business from paying the price in two distinct ways.

The Financial Impact of Stockouts

Growth thrives on availability, whereas stockouts often act as a silent killer. The immediate impact is obvious: missed revenue. But the long-term damage is worse. Studies show that roughly 26% of customers will permanently switch brands after facing a stockout. Retention means keeping that sale instead of handing your customer to a competitor.

The Burden of Inventory Costs

Maintaining lean inventory prevents the dangers of over-compensating by hoarding stock. Inventory holding costs, including warehousing, insurance, spoilage, and obsolescence, typically eat up 20% to 30% of your total inventory value every year. Keeping levels optimized saves the $2–3 million annually that might otherwise be wasted on maintenance for $10 million in excess stock.

Consider a typical retailer preparing for Black Friday. A data-driven forecast avoids the risks of guessing based on last year’s flat numbers. Detecting a 20% spike in demand ensures you don’t stock out by noon and lose millions. Precision acts as the only safety net against overestimation that leaves warehouses full of discounted goods in January.

Comparative Analysis of Demand Forecasting Methods

Selecting the right method depends heavily on your organization’s “Data Maturity,” meaning how accessible, clean, and granular your data is.

Qualitative Methods (Low Data Maturity)

These methods rely on expert opinion rather than hard data.

Quantitative Time-Series Analysis (Medium Data Maturity)

These involve statistical math applied to historical data.

Advanced Data Science (High Data Maturity – The Stellans Way)

We help our clients transcend basic analytics here.

Step-by-Step Guide: Implementing a Data-Driven Forecasting Engine

Transitioning to advanced data science creates a data engineering opportunity rather than just a mathematical one. At Stellans, we emphasize that the quality of your forecast is defined by the quality of your pipeline.

Step 1: The Data Foundation (Data Engineering)

Building a skyscraper requires a solid foundation. The first step brings your data into a central modern cloud warehouse like Snowflake.

Once the data is centralized, we use dbt (data build tool) for transformation. Raw data is messy; it often has null values, duplicates, and timezone errors. We build robust pipelines to:

For a deeper dive into how we structure these transformations, check out our guide on dbt macros, which are essential for keeping your forecasting logic clean and reusable.

Step 2: Feature Engineering

Algorithms learn best when provided with good “features” (variables). Good features make good models.

Step 3: Model Selection & Training

For business time-series data, Facebook Prophet is often our weapon of choice. It leverages an additive model that handles seasonality (yearly, weekly, daily) incredibly well and is robust to missing data.

To handle complex scenarios with dozens of interacting variables, XGBoost (Extreme Gradient Boosting) often outperforms. We frequently use a “champion/challenger” approach, running multiple models and letting the data decide which one fits a specific SKU best.

Step 4: Validation (Backtesting)

Deploying a model requires rigorous validation. We perform rigorous backtesting by running the model on past data (e.g., predicting 2023 sales using 2022 data) and comparing the result to what actually happened. We track metrics like MAPE (Mean Absolute Percentage Error). Our goal is typically to drive error rates below 10%, giving you a reliable baseline for decision-making.

For a real-world example of how we build these high-performance systems, read about our Data-Driven Demand Forecasting work, where we helped clients scale their analytics capabilities.

Overcoming Common Implementation Challenges

Proper management ensures success even with the best tech stack.

Data Quality: “Garbage In, Garbage Out.”

Sophisticated AI requires clean data to function effectively. If your inventory records are 70% accurate, your forecast will be equally flawed. This is why we prioritize automated data governance and testing within the dbt pipeline to catch errors before they hit the model.

Siloed Departments

Collaboration prevents the issues that arise when the marketing team plans a 50% discount promo without telling the supply chain team. The result is often a massive stockout. Forecasting requires cross-functional collaboration. This is where a Fractional Chief Data Officer can be invaluable. They provide the executive leadership needed to bridge the gap between Sales, Marketing, and Operations, ensuring data flows freely between departments.

Change Management

Overcoming human nature is often the hardest part. Stakeholders may trust their “gut” over the algorithm. Building trust takes time. We recommend running the new forecasting engine alongside the old method for a quarter to prove its superiority with hard numbers.

Conclusion & Next Steps

Demand forecasting delivers capital efficiency and business resilience, going far beyond just keeping the shelves full. Reducing stockouts allows you to capture lost revenue. Optimizing inventory frees up cash flow.

The journey from spreadsheets to a predictive engine like Prophet or XGBoost is the definitive path to a modern, resilient supply chain. Don’t let data integration challenges hold you back.

Refining your supply chain starts with a conversation. Contact Stellans today, and let’s discuss how we can engineer a custom demand forecasting solution that grows with your business.

Frequently Asked Questions

What is the difference between demand planning and demand forecasting?

Demand forecasting is the unconstrained prediction of what customers will buy based on data. Demand planning is the broader process that takes that forecast and applies business constraints, such as manufacturing capacity, cash flow, and supplier lead times, to decide how much inventory to actually order.

How does AI improve demand forecasting?

AI and machine learning models analyze vast amounts of “unstructured” or complex data, unlike traditional statistical methods. They can detect subtle non-linear patterns, such as how specific weather conditions affect sales of a specific SKU, or how social media trends correlate with demand spikes.

Why is Snowflake recommended for forecasting data?

Snowflake offers a scalable, cloud-native architecture that separates storage from compute. This allows you to store massive amounts of historical data cost-effectively while giving you the raw power to run complex machine learning queries without slowing down your daily operational reporting.

Can small businesses use advanced forecasting?

Absolutely. Small businesses can access this technology through a “Fractional Data Team” approach without hiring a full in-house data science department. You get the enterprise-grade capability at a fraction of the cost.

What is a good MAPE (accuracy) score?

A MAPE (Mean Absolute Percentage Error) of under 10% is generally considered excellent for stable products, though this varies by industry. For highly volatile or fashion-driven items, a MAPE of 20-30% might be the industry standard.

References:

  1. Facebook Prophet Documentation
  2. McKinsey & Company: Supply Chain Analytics

Article By:

https://stellans.io/wp-content/uploads/2026/01/1723232006354-1.jpg
Roman Sterjanov

Data Analyst

Related Posts

    Get a Free Data Audit

    * You can attach up to 3 files, each up to 3MB, in doc, docx, pdf, ppt, or pptx format.