What Is Data Science for Product Managers: Leveraging Analytics for Growth

13 minutes to read
Get free consultation

Introduction to Data Science for Product Managers


Product managers can gain deep visibility into true business drivers by moving beyond basic dashboards. Traditional approaches provide limited visibility into true business drivers. Simple reporting tells you what happened yesterday. Data science explains why those events occurred and shows how to replicate them tomorrow. We partner with product teams to unlock their true data potential.

Data science acts as a robust decision system. It replaces guesswork with statistical certainty. Building rigorous data systems helps teams prevent blind feature launches. You can deploy new updates based on solid evidence rather than gut instinct. This approach optimizes engineering hours and accelerates growth metrics. We view your data pipeline as a highway: it needs clear lanes and strict rules to maintain speed.

We streamline technical processes to empower your decision-making. Data science transitions your team from passive observation to active optimization. You can move past simply asking what happened in your application. You start predicting user behaviors and calculating exact revenue impacts. Our goal is to drive your long-term growth. We help you transform raw behavioral data into a competitive product advantage.

How Data Science Informs Product Decisions

Data science bridges the gap between raw data and product strategy. Teams must navigate three distinct analytical phases to achieve consistent growth.

Descriptive, Predictive, and Causal Questions

Descriptive analytics provides historical context. It powers standard business intelligence dashboards. You see active users, daily sign-ups, and baseline revenue. This phase remains essential for monitoring product health. To drive strategic growth, you can combine descriptive analytics with predictive models.

Predictive analytics looks toward future outcomes. Machine learning models analyze historical patterns to forecast user behavior. We build predictive models to identify high-churn users before they cancel. This allows your growth team to trigger proactive retention campaigns. Predictive insights empower you to act early and sustain revenue.

Causal inference represents the highest level of product analytics. It answers a fundamental question: did this specific feature cause our metrics to change? Correlation does not equal causation. A user might engage with a new feature and upgrade their account. We use causal inference methods to prove the feature actually caused the upgrade. This ensures accurate results and secures reliable growth.

Data Science Workflow for Product Teams

A healthy workflow requires tight collaboration between product and data teams. Product managers define the business problem. Data scientists design the statistical approach to solve it. We ensure this process remains seamless.

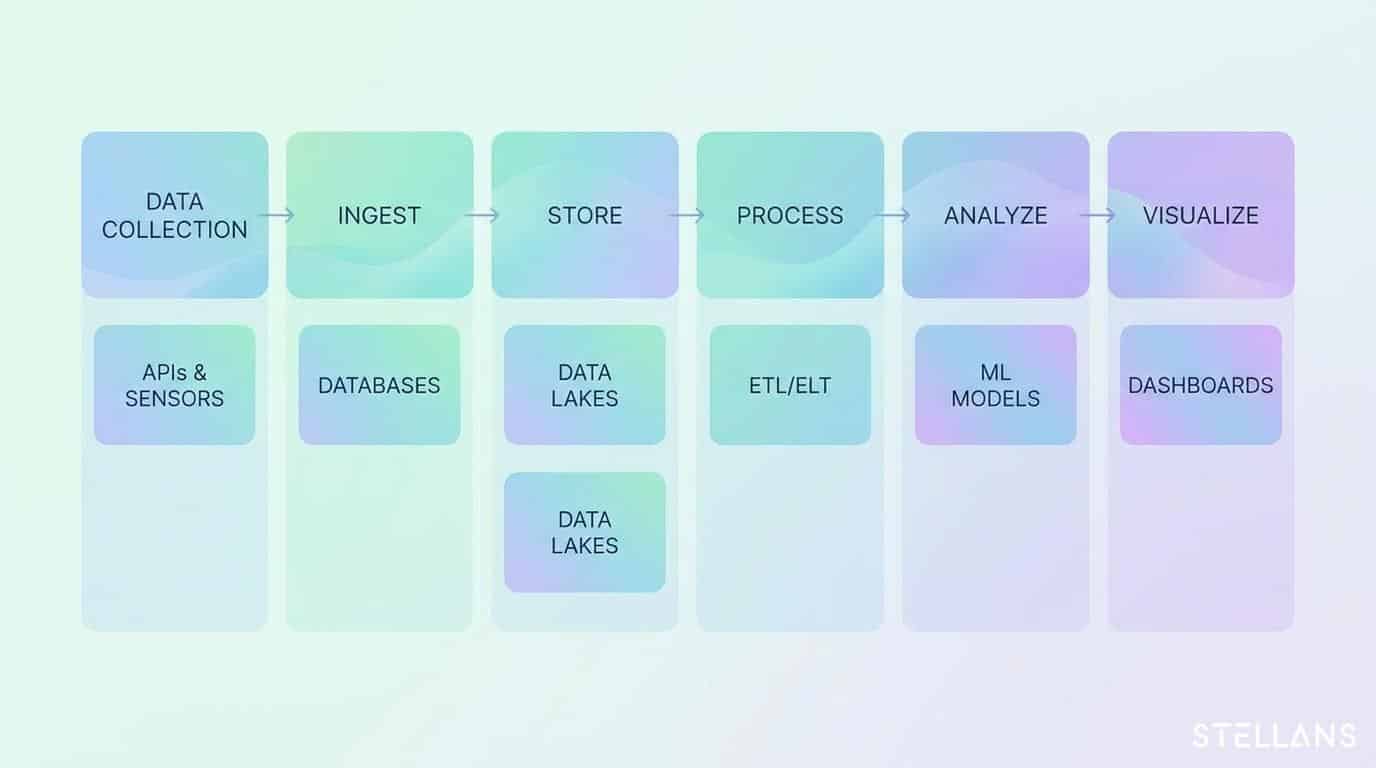
The workflow begins with proper data collection. Telemetry pipelines capture user interactions reliably. Data engineers clean and format this information. Scientists then apply statistical models to extract insights. Finally, product leaders use these insights to adjust the product roadmap. We design this entire system to run smoothly: our infrastructure ensures error-free reporting at every stage.

Building a Hypothesis Testing Framework for Feature Rollouts

Product teams achieve clarity in their experiments by using data science. You can run an A/B test and observe clear metric trends. Teams can confidently launch features based on conclusive results. We solve testing challenges by implementing a strict hypothesis testing framework. This blueprint guarantees reliable feature rollouts.

Step 1: State the Product Problem

You must define the problem in behavioral terms. Start by identifying the core issue rather than a predetermined solution. An effective problem statement focuses on user behavior.

Poor: “We need a faster checkout button to increase sales.” Effective: “Users abandon their carts at a 40% rate during the final payment step.”

We help teams isolate the exact behavioral drop-off. This clarity streamlines the entire testing process.

Step 2: Define the Primary Hypothesis

A strong hypothesis provides a clear, testable structure. It identifies the target population, the intervention, and the expected outcome. We use a standard template to ensure scientific rigor.

“If we introduce a one-click payment option for returning mobile users, then checkout completion will increase by a 5% relative margin.”

This structure sets clear expectations. It gives data scientists a precise target for their statistical models.

Step 3: Select Primary and Guardrail Metrics

Selecting the right metrics ensures successful product updates. You need one primary metric to measure success. You also need guardrail metrics to monitor system stability.

Your primary metric might be the activation rate. Your guardrail metric should track system errors or cancellation rates. We establish these boundaries to protect your core revenue streams. If a new feature increases engagement, the guardrail metric ensures customer support tickets remain stable.

Step 4: Pre-register Decision Rules

Teams achieve consensus on test results by planning ahead. We foster alignment through pre-registration. You document exactly what constitutes a win before launching the experiment.

You must define the minimum meaningful effect size. By identifying substantial improvements, you ensure the benefits outweigh the engineering maintenance costs. Pre-registration aligns stakeholders and accelerates product decisions.

Structuring Event Telemetry for Reliable Analytics

Cross-functional teams collaborate best when they rely on clean data. Standardizing naming conventions between engineering and analytics creates harmony. Data scientists can focus on building models rather than cleaning data. We support this alignment by treating your data pipeline as a highly organized highway.

We provide a comprehensive blueprint for structuring event telemetry. This applies to tools like Amplitude, Segment, or custom data pipelines. Proper architecture accelerates model deployment. Clients report 40% faster insights post-implementation when using our standardized telemetry models.

Separating Event Names from Properties

Many teams improve data organization by avoiding unique event names for every user action. Tracking specific buttons like “clicked_red_button” and “clicked_blue_button” can complicate your database.

We streamline this by standardizing event actions and utilizing contextual properties.

{
  "event_name": "subscription_started",
  "user_id": "usr_89234",
  "timestamp": "2023-10-15T14:32:00Z",
  "properties": {
    "plan_tier": "premium",
    "billing_cycle": "annual",
    "promo_code_used": true,
    "entry_point": "pricing_page_modal"
  }
}

This JSON structure ensures clean data aggregation. Data scientists can easily group events by plan_tier or billing_cycle. We implement these schemas to guarantee reliable downstream reporting.

Unified Tracking Plans

A tracking plan serves as the single source of truth. It documents every event, its trigger condition, and its required properties. We build scalable systems that enforce this tracking plan automatically. If an engineer deploys code with an unregistered event, the pipeline flags it for review. This strict governance keeps your analytics warehouse pristine and accurate.

Product Analytics Metrics Comparison: MAU vs Retention Cohorts

Product leaders gain true clarity by tracking the right key performance indicators. This creates a strong foundation for decision making. We help teams transition from high-level metrics to actionable health indicators.

The Illusion of Monthly Active Users (MAU)

Monthly Active Users (MAU) tracks the total number of unique visitors in a 30-day period. Investors often request this metric. However, product managers gain deeper insights by looking beyond MAU.

A massive marketing campaign can temporarily boost MAU. You might acquire 10,000 new users in one week. Your MAU chart shows a steep upward trend. We encourage clients to look deeper than this aggregate number. Exploring retention metrics provides a clearer picture of user loyalty. While you might acquire new users, understanding how many older users stay active is crucial for sustainable growth. Keeping your user base strong is key to long-term success.

The Reality of Retention Cohorts

Retention cohorts reveal the true value of your product. We group users based on their sign-up date. We then track their engagement over subsequent weeks or months.

Imagine tracking a cohort of users who signed up in January.

Identifying retention trends helps you boost your product’s long-term value. We help you analyze these cohort heatmaps to discover exact engagement points. Cohort analysis allows you to measure product-market fit accurately. It focuses your engineering efforts on optimizing user retention to maximize the value of your acquisition spend.

Understanding A/B Testing Analytics for Product Decisions

Rigorous A/B testing propels successful companies forward. Testing replaces internal opinions with objective market feedback. We empower teams to achieve better management through A/B testing by defining strict statistical guidelines.

Statistical Power and Sample Size

Trusting an A/B test requires a sufficient sample size. Statistical power determines your ability to detect a true effect. Maintaining high statistical power ensures you confidently launch winning features.

We calculate the exact sample size required before you launch an experiment. When dealing with specific traffic volumes, we help product managers identify testing timelines early. You can then choose to test bolder features that require smaller sample sizes to prove impact.

Avoiding the Peeking Problem

Product managers can ensure accuracy by letting A/B tests run their full course. Checking results early and stopping the test can compromise the data. This situation is known as the peeking problem.

Early fluctuations happen purely by chance. Completing the full test duration ensures accurate conclusions. You can confidently deploy features that enhance your product. We configure your testing infrastructure to reveal results only after reaching the required sample size. This discipline supports confident feature launches and ensures long-term metric stability.

Developing a Data-Driven Product Roadmap

A product roadmap serves as a strategic document backed by quantitative evidence. We partner with you to align your technology choices with long-term business goals.

Combining Qualitative and Quantitative Data

User interviews provide excellent qualitative feedback. Customers tell you they want a faster reporting dashboard. By pairing this with quantitative data science, you can accurately measure the potential return on investment and size the market opportunity.

We analyze your event telemetry to see how many users currently interact with the reporting module. We use data science to score roadmap items based on actual usage patterns, ensuring engineering efforts are directed toward high-impact features.

Opportunity Sizing Models

Data science helps prioritize the product backlog. We build opportunity sizing models that forecast the revenue impact of each proposed feature. These models account for user segment size, current conversion rates, and expected uplift. This analytical rigor ensures your engineering team only builds features that drive measurable growth.

Common Pitfalls: Privacy, Governance, and Responsible Analytics

Scaling a data-driven product team highlights the importance of responsible data management. You can maintain user trust and ensure compliance by handling data carefully. We help you achieve this through strict data governance frameworks.

Privacy-by-Design

Building privacy into a data system from the start ensures security. We implement privacy-by-design principles from the very beginning. Personal identifiable information (PII) is masked before it enters the data warehouse. Data scientists can accurately predict churn probability while fully protecting a user’s real identity.

Establishing Robust Governance

Strong governance creates clear and organized data environments. Implementing role-based access control keeps your metrics accurate. We build scalable systems and infrastructure that enforce these access controls.

We ensure that your data pipelines remain secure and compliant. Clear data contracts prevent engineering updates from breaking analytical models. Our governance strategies create a reliable foundation for all advanced machine learning initiatives.

How Stellans Helps Enable Data-Driven Product Management

Transitioning to a data-driven product culture requires deep technical expertise. You need reliable infrastructure, clean telemetry, and advanced statistical models. We work with you to unlock this data potential.

Stellans offers comprehensive Advanced Data Science Services to accelerate your growth. We provide highly tailored insights beyond generic dashboards. We implement full causal inference frameworks customized to your specific business needs. Our team partners with your product managers to design rigorous hypothesis tests and ensure successful experiments.

Furthermore, our experts guide your overall digital transformation and strategy. We ensure your technology choices align directly with your revenue targets. We streamline your event telemetry, build predictive machine learning models, and secure your data pipelines.

Let our outcomes speak for themselves. Clients achieve faster insights, cleaner data, and highly confident product rollouts when they leverage our expertise. We turn your complex data into clear, actionable growth strategies.

Frequently Asked Questions

What is the difference between product analytics and data science?

Product analytics primarily focuses on descriptive metrics like dashboards and funnel analysis. Data science encompasses predictive modeling, advanced statistical analysis, and causal inference to determine why user behaviors happen and how features impact long-term growth.

What is the difference between MAU and retention cohorts?

Monthly Active Users (MAU) measures the total unique users in a month, which can be influenced by new acquisitions. Retention cohorts track specific groups of users over time to see how they continue to find value and return to the product, providing a more accurate measure of product health.

How should product teams prepare data for data scientists?

Product teams must build a strict event telemetry blueprint that separates event names from contextual properties, establishes a unified tracking plan, and standardizes identity resolution before feeding data into a warehouse for data scientists.

Why do so many A/B tests fail to show results?

A/B tests yield the best results with sufficient statistical power, well-defined primary metrics, and full-duration testing. Teams achieve success by testing changes that generate a minimum meaningful effect. A strict hypothesis testing framework supports these best practices.

Can data science prioritize my product roadmap?

Yes. Data science combines qualitative user feedback with quantitative opportunity sizing. We build models to forecast the exact revenue impact of proposed features, ensuring your engineering team focuses exclusively on high-growth initiatives.

Ready to transition from basic reporting to advanced predictive analytics? Our goal is your growth. Reach out to us today to schedule a consultation and transform your product strategy.

References:

  1. Duke University Fuqua School of Business: Beyond A/B Testing: Using AI to Uncover What Works
  2. MIT Sloan Management Review: Tech-Savvy: Better Management Through A/B Testing

Article By:

https://stellans.io/wp-content/uploads/2026/01/Vitaly_Lilich.jpg
Vitaly Lilich

Co-founder and CEO

Related Posts

    Get a Free Data Audit

    * You can attach up to 3 files, each up to 3MB, in doc, docx, pdf, ppt, or pptx format.
    This site is protected by reCAPTCHA and the Google Privacy Policy and Terms of Service apply.