Multi-Touch Attribution in 2026: The Complete Implementation Guide

16 minutes to read
Get free consultation


The digital marketing landscape empowers teams through total analytical clarity. The year 2026 demands a complete shift toward transparent software tools. Marketing teams can now embrace this new reality. Open vendor solutions illuminate critical campaign data, whereas legacy proprietary tools obscure it. They offer pre-packaged numbers without revealing the underlying mathematical pathways. Total transparency captures revenue opportunities and optimizes budgets.

We empower organizations to build customized, warehouse-native analytics environments. Internal data teams can reclaim control over their customer logic. Building an attribution mechanism directly within your own cloud architecture solves this transparency problem. You own the code. You own the customer touchpoints. You own the actionable insights. This guide outlines the exact methodological blueprints needed for success. We will explore complex models, define vital data requirements, and provide a practitioner-level tutorial for implementing multi-touch setups using modern data build tools.

What is Multi-Touch Attribution and Why It Matters Now

Measuring channel return on investment reveals powerful opportunities when done correctly. Customer journeys present dynamic, multi-channel opportunities. A user might discover an initial product via a paid social media advertisement. They might sign up for a newsletter two days later. The final purchase might happen weeks later through a direct branded search. Multi-touch attribution captures this entire fragmented journey. It assigns financial credit to every single interaction along the path to conversion.

Cookieless Tracking and Privacy Hurdles

Robust first-party data strategies build a foundation for modern success. Privacy regulations reshape marketing workflows by encouraging transparent data relationships instead of invasive third-party cookie tracking. Businesses must pivot toward robust first-party data strategies. Our data engineers design systems that prioritize privacy by design. We help clients collect compliant event streams directly from their own domain properties. This ensures compliance with modern data privacy guidelines while maintaining highly accurate analytics infrastructure. Capturing first-party actions builds a durable foundation for long-term marketing growth.

Multi-Touch (MTA) vs. Marketing Mix Modeling (MMM)

Many analysts confuse multi-touch frameworks with marketing mix modeling. Both methodologies measure performance. However, they operate on completely different analytical levels. MTA handles highly tactical, user-level paths over short timeframes. It tells you exactly which specific email campaign drove a Tuesday purchase.

MMM handles aggregate cross-channel budgets over macroscopic time horizons. It analyzes broad statistical correlations without relying on user-level identifiers. MMM answers high-level questions about quarterly television spending. MTA provides the day-to-day granular feedback needed to optimize active digital campaigns. We routinely build robust marketing analytics setups that incorporate both methodologies for totally comprehensive insights.

A Comparison of Marketing Attribution Models

Every attribution model reveals unique truths about customer behavior. Different business models benefit immensely from applying their specific analytical lenses. We help clients test multiple frameworks against their historical data. Exploring various methodologies reveals hidden performance trends within specific channels. Below is an overview of the primary frameworks utilized today.

Model Type Pros & Cons Best Used For
Linear Pros: Simple, honors all touches.
Cons: Overvalues low-impact touches.
Long B2B nurturing cycles requiring equal touchpoint valuation.
Time-Decay Pros: Rewards closing channels.
Cons: Undervalues top-of-funnel awareness.
Short promotional campaigns with rapid buying cycles.
U-Shaped Pros: Highlights acquisition and conversion.
Cons: Ignores the middle engagement.
Highly aggressive lead generation marketing strategies.
Data-Driven Pros: Algorithmic, highly accurate.
Cons: Requires heavy data volumes.
Enterprises with heavy traffic and strong data engineering teams.

Linear Attribution

Linear attribution flattens the complexity of the customer journey. It distributes financial credit completely evenly across every recorded touchpoint. If a customer interacts with four ads before purchasing, each ad receives exactly twenty-five percent of the value.

This model excels at simplicity. It acknowledges that every marketing effort contributes to the final goal. It evenly values all steps, though specialized models better highlight high-impact pivot points. A routine retargeting banner gets the exact same weight as a deep, two-hour webinar. We recommend this model only for organizations with very uniform, relationship-based engagement cycles.

Time-Decay Attribution

Time-decay attribution applies a strict recency effect. It utilizes an exponential mathematical decay function. Touchpoints occurring closer to the actual conversion event receive significantly more credit. A search click on the final day earns a high reward. A blog post read three weeks prior receives a tiny fraction of the final value.

This framework actively favors bottom-of-the-funnel tactics. It operates effectively for companies running flash sales or limited-time promotional events. The model logically assumes that recent interactions heavily drove the final purchase decision. Other models excel for high-ticket items requiring extensive preliminary research.

U-Shaped (Position-Based)

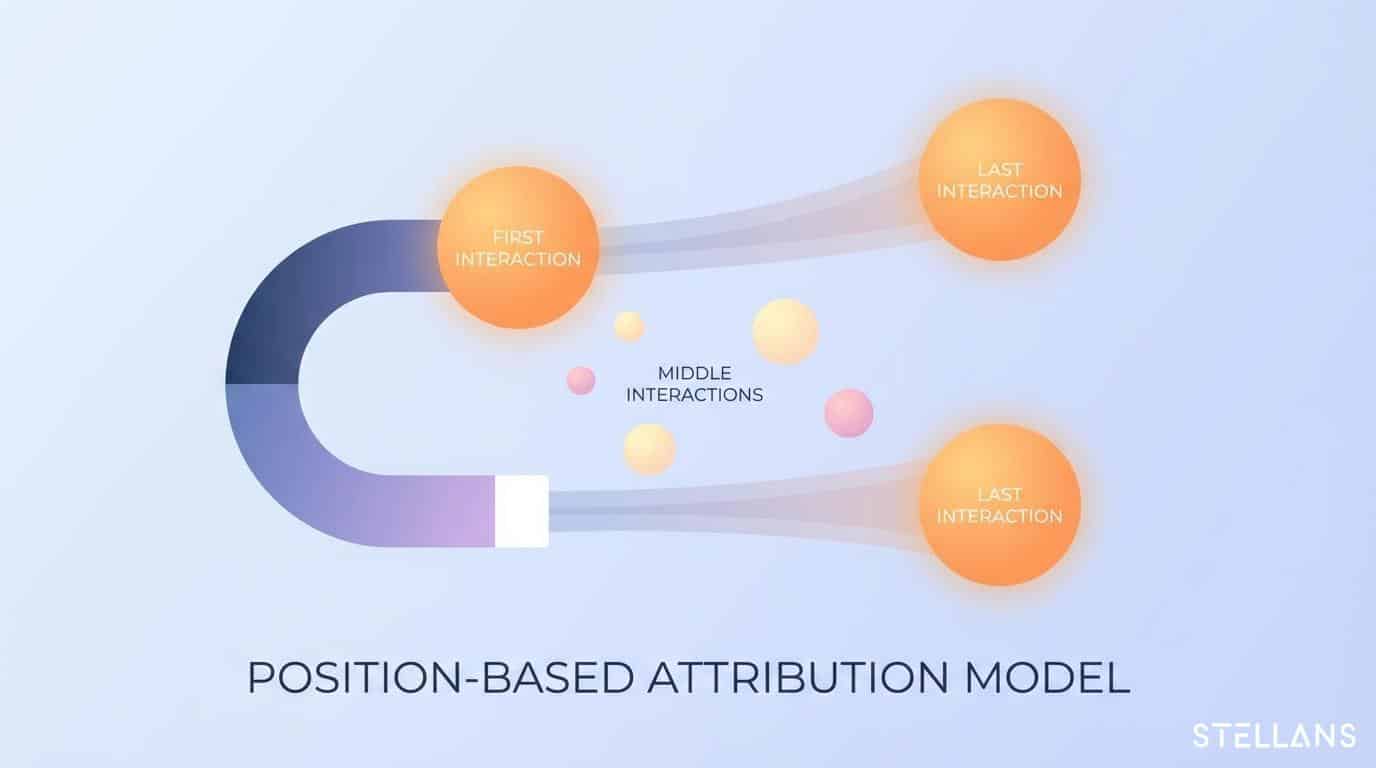
U-Shaped attribution recognizes the absolute importance of the extreme ends of the funnel. It typically utilizes a strict 40-20-40 percentage split. The very first interaction gets forty percent of the resulting credit. The final converting interaction also gets forty percent. All remaining middle interactions share the leftover twenty percent equally.

This position-based logic rewards the “opener” and the “closer” channels. We find this highly effective for organizations prioritizing new user acquisition alongside rapid checkout conversion. The model explicitly acknowledges that capturing attention and securing payment are the most critical marketing tasks.

Data-Driven Attribution

Data-driven attribution uncovers the algorithmic truth hidden within your specific historical data by embracing complete flexibility over fixed rule sets. Most modern mathematical approaches utilize either Markov chain methodologies or advanced Shapley value concepts.

Transition probability matrices power the Markov chain approach. The system calculates the specific “removal effect” of a channel. It asks a theoretical question: if we completely remove social media from our ecosystem, how drastically do conversions drop? Shapley values pull from cooperative game theory. They calculate the precise marginal contribution of a channel as it joins an ongoing customer sequence. Data-driven methods provide the most accurate budget allocation available today.

The Data Requirements for Building an MTA Model

High-quality attribution output strictly requires high-quality data input. Attribution acts primarily as a powerful data engineering opportunity. Technical leaders sometimes mistake it as a pure mathematics problem. You must construct a well-oiled machine for data ingestion.

Unified Event-Level Data

Unified information guarantees attribution accuracy by eliminating data silos. You must combine online web traffic logs with offline enterprise data. This includes merging Google Analytics hit streams with Salesforce CRM touchpoints. We help organizations build data pipelines and scalable systems to capture this unified event log.

Every single event needs a precise timestamp. Every single event needs a standardized channel classification. Your raw data layer must act as an immaculate timeline. If a sales representative makes an offline phone call, that event must join the digital web stream flawlessly.

Clean Conversion & Value Data

Tying marketing touches directly to true financial metrics provides incredible business value. Counting only raw leads provides just a partial view. A marketing channel might generate hundreds of cheap clicks. Channels prove their true value when those clicks translate directly into closed revenue.

Systems must connect initial touchpoints to ultimate lifetime value parameters. The data warehouse must store accurate net profit margins for every converted order. Your final attribution models should optimize for gross margin dollars instead of basic conversion counts. This pivot transforms marketing from a cost center into a predictable profit engine.

Identity Resolution

Customers utilize multiple devices during standard purchasing routines. They browse on mobile phones during their commute. They complete complex purchases on desktop computers at home. Identity resolution stitches these anonymous cookies to known user profiles securely.

This matching process utilizes both deterministic and probabilistic logic. Deterministic matching relies on hard identifiers like provided email addresses. Probabilistic methods utilize behavioral clustering. When our team integrates identity mapping into the primary event stream, we notice massive jumps in path accuracy. Anonymous, fragmented sessions suddenly become single, cohesive historical timelines.

How to Use dbt to Model Customer Touchpoints in a Data Warehouse

Modern attribution completely relies on modular SQL development. We strongly advocate following established dbt modeling practices to build transparent analytics. The data build tool framework turns messy SQL scripts into version-controlled analytical assets. This practitioner-level section outlines five necessary layers to compute touchpoint weights seamlessly.

Layer 1: Staging Models

The first technical layer normalizes raw extraction streams. Different advertising networks utilize wildly different column naming structures. Staging models harmonize these divergent formats into a clean, uniform standard. You must create initial views for both stg_events and stg_conversions.

-- stg_events.sql
WITH raw_web AS (
    SELECT
        event_id,
        anonymous_id,
        user_id,
        event_timestamp,
        utm_source,
        utm_medium,
        utm_campaign,
        'web' AS channel_type
    FROM {{ source('raw_data', 'web_events') }}
)

SELECT * FROM raw_web
WHERE event_timestamp IS NOT NULL

This code snippet standardizes digital web events. It casts explicit data types and removes null timestamp entries. Clean inputs translate directly to accurate budget allocations later in the pipeline. We enforce strict data types here to prevent downstream casting errors.

Layer 2: Identity Stitching

Layer two handles the complex identity resolution problem. We must create a unified mapping table called stg_identity_map. This table connects transient anonymous cookie profiles to permanent internal user tags.

You isolate instances where both an anonymous_id and a user_id exist simultaneously. This typically happens during an account login event or a checkout process. You group these records to generate a persistent master key. Every historical event tied to that specific anonymous cookie instantly maps backward to the known user. This process bridges the device gap seamlessly throughout the data warehouse.

Layer 3: Building Core Touchpoint Facts

The third layer constructs the canonical exposure table. It pulls from search ad clicks, organic search pages, paid social interactions, and direct email opens. We define this unified table as fact_touchpoints.

You will union all cleaned staging tables together. You must resolve the previously mapped identities against these unified events. The resulting table provides a master chronological log of every marketing engagement across the entire organization. Every row represents a solitary, identifiable interaction. This acts as the structural spine for your entire multi-touch analytics project.

Layer 4: Constructing Conversion Paths

You must logically order the historical journeys. The fct_attribution_path model joins the closed conversion events back onto the master touchpoint log. It relies heavily on standard SQL window functions.

You restrict the join using a defined lookback window. A standard parameter might cap the timeline at thirty days before conversion. You then partition the data logically by the target conversion metric.

-- fct_attribution_path.sql
WITH joined_paths AS (
    SELECT
        c.conversion_id,
        c.conversion_revenue,
        t.event_id,
        t.utm_campaign,
        t.event_timestamp,
        ROW_NUMBER() OVER (
            PARTITION BY c.conversion_id 
            ORDER BY t.event_timestamp ASC
        ) AS touchpoint_sequence_asc,
        COUNT(t.event_id) OVER (
            PARTITION BY c.conversion_id
        ) AS total_path_touches
    FROM {{ ref('stg_conversions') }} c
    LEFT JOIN {{ ref('fact_touchpoints') }} t
        ON c.user_id = t.user_id
        AND t.event_timestamp <= c.conversion_timestamp
        AND t.event_timestamp >= DATEADD(day, -30, c.conversion_timestamp)
)
SELECT * FROM joined_paths

This model calculates the total number of interactions per purchase. The ROW_NUMBER() logic organizes the chronological timeline flawlessly. It explicitly defines the very first touch, the intermediate interactions, and the final conversion click. Data analysts rely heavily on this sequenced output.

Layer 5: Applying Attribution Logic With Macros

The final reporting layer applies specific mathematical weights. We designate this model as fct_attribution_credits. We recommend utilizing dbt macros to build dynamic attribution formulas. This allows teams to instantly toggle between linear sets or U-shaped frameworks.

You apply basic fraction math against the total paths generated in layer four. If a journey contains four total touches, a linear formula assigns a twenty-five percent fractional credit to each connected event_id. You multiply this finalized decimal percentage against the total conversion_revenue. This outputs the exact dollar amount attributed to every distinct marketing campaign. Marketing executives use this final, revenue-weighted table to make daily budgetary decisions.

Overcoming Common MTA Implementation Challenges

Implementing warehouse-native analytics introduces exciting structural capabilities alongside new technical requirements. Organizations achieve success by properly estimating the raw architectural effort required. Our engineering teams frequently navigate these specific roadblocks during early client onboarding phases.

Bridging the Offline-to-Online Gap

Unified systems accelerate modern analytical insights, replacing the delays of fragmented legacy systems. Digital event logs easily track basic website clicks. Synchronizing offline sales systems yields tremendous rewards, despite the synchronization effort. A lucrative B2B software contract might close over a traditional telephone call.

We streamline these fractured data systems. We orchestrate reverse ETL pipelines that push CRM stage changes directly back into the cloud event log. This process demands rigorous standardization of timestamps across conflicting software vendors. We ensure your offline retail receipts and digital social ads flow into the same standardized data format.

Ensuring Data Quality & Governance

Immaculate data pipelines empower complex machine-learning algorithms. Outstanding inputs guarantee highly accurate marketing weights. Organizations must implement rigid DataOps practices immediately.

We rely heavily on automated dbt testing suites. We deploy not_null assertions on all critical revenue columns. We enforce unique constraints on every finalized touchpoint ID. These automated checks catch sudden data anomalies instantly. Proper data testing ensures that your marketing managers always review authenticated, reliable performance metrics.

Leveraging MTA for True Campaign Optimization

Technology projects generate massive ROI when paired with clear business action. We build data platforms to directly increase your bottom-line profitability. Marketing leaders must ingest these finalized mart tables into intuitive BI visualization logic.

Dashboards must clearly highlight wasted ad spend. Managers use these granular insights to confidently pause underperforming social media campaigns. They actively scale budgets on high-ROI search networks that historically close deals. Clients report forty percent faster decision cycles post-implementation. The attribution engine transforms raw engineering effort into an automated profit optimization tool. Total transparency gives you total command over your marketing destiny.

Conclusion

The 2026 digital marketplace requires an absolute commitment to data transparency. Internal warehouse-native pipelines easily outperform expensive, closed-book vendor tools. By clearly understanding various mathematical formulas, organizing high-level event data, and deploying structured dbt modules, teams can unlock incredible marketing potential.

We design systems that turn massive data complexity into a well-oiled growth machine. Partner with our team to streamline your advanced data architecture today. Connect with us via our main website to discover how tailored analytics engineering will empower your long-term business strategy.

Frequently Asked Questions

What is the difference between multi-touch attribution and marketing mix modeling? Multi-touch attribution analyzes specific, user-level conversion paths over short timelines. It helps managers adjust daily digital ad bids based on granular interactions. Marketing mix modeling uses top-down statistical regressions to examine aggregate spending over long periods. MMM evaluates macro-level trends like television spending or seasonal demand shifts without needing specific user cookies.

How do you use dbt for multi-touch attribution implementation? You utilize dbt to transform messy raw data into ordered sequential paths. First, staging models clean your diverse advertising sources. Next, identity stitching scripts link anonymous behavior to known users. You then build chronological paths using standard SQL window functions like ROW_NUMBER(). Finally, customized macros apply mathematical weights to calculate the exact revenue generated by each distinct touchpoint.

What are the data requirements for data-driven attribution? Data-driven attribution models require highly accurate, unified event data spanning both offline and online channels. You must maintain strict identity resolution frameworks to connect multi-device user journeys seamlessly. Furthermore, robust data-driven models require substantial historical data volumes. Sparse traffic prevents the machine learning algorithms from properly calculating complex Shapley values or transition probability matrices.

Article By:

https://stellans.io/wp-content/uploads/2026/01/Vitaly_Lilich.jpg
Vitaly Lilich

Co-founder & CEO

Related Posts

    Get a Free Data Audit

    * You can attach up to 3 files, each up to 3MB, in doc, docx, pdf, ppt, or pptx format.