Marketing Analytics: How to Measure and Optimize Your Campaigns

9 minutes to read
Get free consultation


Precision is the new standard for marketing budgets, meaning the era of “spraying and praying” is officially over. In a privacy-first world where every click is scrutinized and every dollar is debated, precision isn’t just a luxury; it is a survival mechanism.

Gaining clarity is the goal, yet for many marketing managers and business owners, the term “marketing analytics” often conjures images of complex spreadsheets, endless dashboards, and data silos that refuse to talk to each other. True marketing analytics goes beyond just Google Analytics reports or checking how many likes a post received. It serves as the compass that guides your strategic decisions, turning raw noise into a clear narrative for growth.

At Stellans, we focus on predicting what comes next rather than just looking backward at what happened. Moving from “I think this works” to “I know this drives revenue” is the ultimate objective. In this guide, we’ll walk you through a strategic framework for measuring what matters, navigating the changing privacy landscape, and optimizing your campaigns for maximum return.

What Is Marketing Analytics and Why Does It Matter?

Marketing analytics is the practice of measuring, managing, and analyzing marketing performance to maximize its effectiveness and optimize return on investment (ROI). It involves gathering data from across all your marketing channels, including social media, email, paid search, and organic traffic, and consolidating it into a single source of truth.

Beyond Simple Reporting

Understanding the fundamental difference between reporting and analytics is crucial, though the terms are often used interchangeably.

Translating noise into narrative is our specialty. Analytics reveals that a dip in traffic is actually a shedding of low-quality bot traffic, resulting in a higher conversion rate for genuine customers. In contrast, simple reporting might just show the dip.

The Critical Role of Analytics in 2026

We are navigating a shifting landscape. Customer Acquisition Costs (CAC) are rising across the board, and the “growth at all costs” mindset has been replaced by a demand for profitability and efficiency. Furthermore, we are staring down the barrel of a privacy revolution. With the deprecation of third-party cookies and the rise of strict data regulations, the old ways of tracking users are disappearing. By 2026, implementing a robust first-party data strategy is essential, as relying on pixel-based tracking will leave you flying blind. You need a system that respects user privacy while still providing value to your stakeholders.

A Guide to Choosing the Right Marketing KPIs to Track

Focusing on the right metrics prevents data paralysis. When you can track everything, the temptation is to report on everything. But not all metrics are created equal. To build a “well-oiled data machine,” you need to distinguish between metrics that make you feel good and metrics that help you make better decisions.

Vanity Metrics vs. Actionable Metrics

Actionable metrics connect marketing activity directly to revenue and business goals, unlike “vanity metrics,” which are numbers that look impressive on the surface but don’t correlate with business success. A post with 10,000 “likes” but zero clicks to your website does not pay the bills.

The Efficiency Layer (The “Right Now”)

These metrics tell you how well your campaigns are running daily. They are the pulse check of your media buying.

The Outcome Layer (The “Business Value”)

This is where the conversation shifts from “marketing spend” to “business investment.”

The Retention Layer (The “Long Game”)

Acquisition is only half the battle.

By implementing Weekly Business Reviews (WBR), you can track these KPIs systematically, ensuring that anomalies are spotted early and successes are celebrated immediately.

How to Measure Marketing Effectiveness in a Fragmented World

deally, a customer sees an ad, clicks, and buys. In reality, a customer sees a LinkedIn post, Googles your brand two days later from their phone, clicks an email a week after that, and finally buys on their desktop. How do you measure that?

Tackling Data Silos

Achieving clear analytics requires overcoming fragmented data. Your Facebook data lives in Meta Business Suite; your email data lives in HubSpot; your sales data lives in Salesforce. Each platform claims credit for the sale, often leading to “double counting” where the sum of attributed conversions exceeds total actual sales.

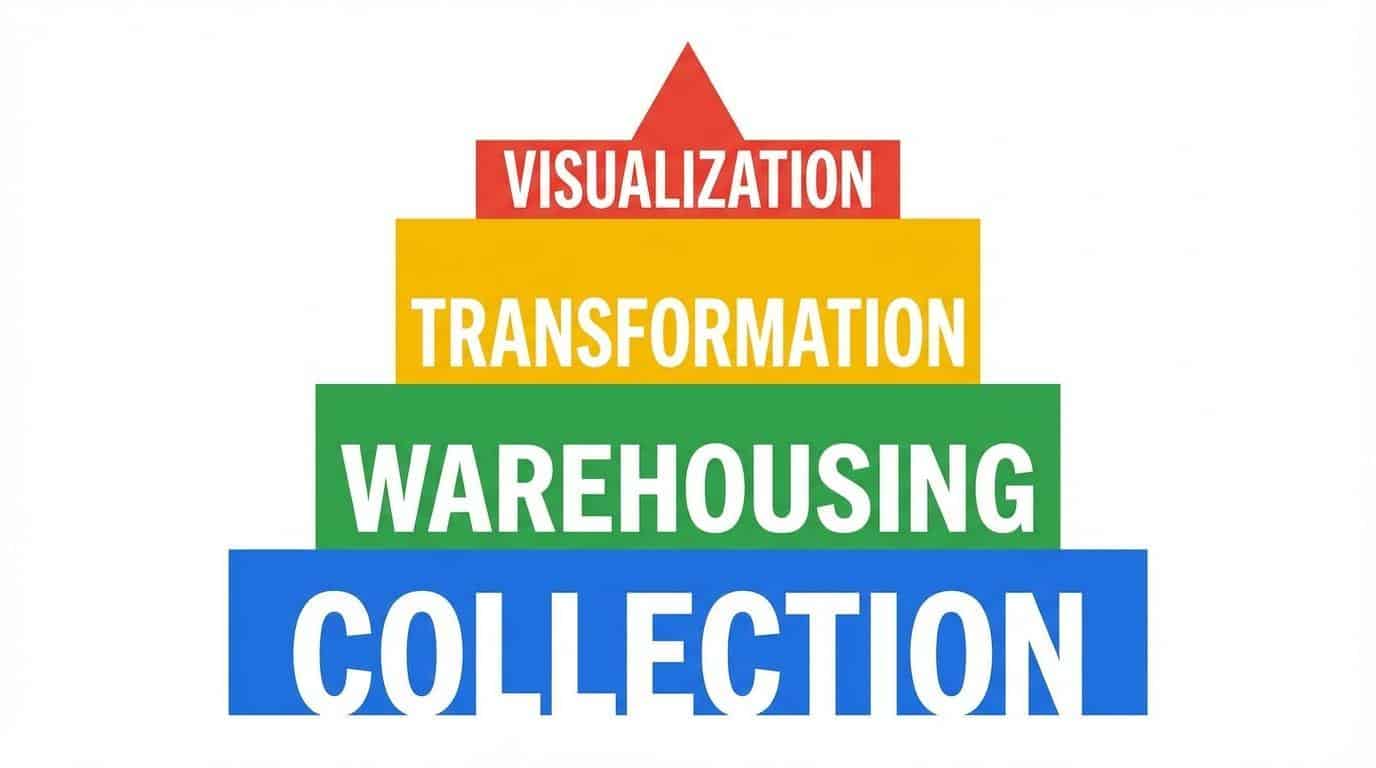
To solve this, you need a Unified Data View. This often involves robust data engineering to build data pipelines that extract raw data from these disparate sources and load it into a centralized data warehouse. Only then can you see the full picture.

Understanding Attribution Models

Attribution is the art of assigning credit to the touchpoints that influenced a conversion.

Consistency is key, as we know that no model is perfect. Understanding how your specific model biases data allows you to make informed decisions rather than searching for a mythical “perfect” number.

The Privacy Paradigm: Measurement Without Cookies

To adapt to the Google Privacy Sandbox and other initiatives rapidly phasing out individual tracking, we generally rely on aggregate measurement methods.

The Role of AI in Measurement

Technology becomes a superpower here. Causal AI allows us to fill in the data gaps left by privacy restrictions. Instead of tracking every user (which is becoming impossible), AI models can probabilistically determine the impact of your marketing efforts, giving you high-confidence insights without compromising user privacy.

Optimizing Your Campaigns: From Insight to Action

Turning data into action prevents it from becoming overhead. The goal of marketing analytics is to create a feedback loop that continuously improves performance.

The Optimization Loop Framework

To turn insights into growth, follow this cycle:

  1. Measure: Collect accurate data.
  2. Analyze: Identify trends and anomalies.
  3. Hypothesize: Create a theory (e.g., “Changing the CTA color will increase clicks”).
  4. Test: Run a controlled experiment.
  5. Repeat: Implement the winner and start again.

Budget Allocation Strategies

Analytics allows you to be fluid with your budget. If the data shows that LinkedIn ads are driving high-CLV customers while display ads are only driving low-quality traffic, you can shift budget dynamically. This isn’t just about saving money; it’s about investing where the yield is highest.

A/B Testing and Creative Performance

Data often reveals insights that contradict “gut feelings,” proving that the “ugly” ad may outperform the polished brand video by 50%. Use rigorous testing to let the audience tell you what they want.

Real-World Application (Stellans Approach)

Consider a mid-market retailer we partnered with. They had a “leaky bucket,” meaning lots of traffic but low conversions. By analyzing their user journey data, we identified a friction point in the checkout process specifically for mobile users.

Tools and Technologies: Building Your Stack

Integrated Analytics Platforms

While we are tool-agnostic, a modern stack typically includes:

Why Tools Aren’t Enough

Mastering the tools is more important than the purchase itself; buying a Ferrari doesn’t make you a racecar driver. Similarly, buying Snowflake doesn’t make you data-driven. The magic lies in how you structure and govern that data. We emphasize structured data conventions to ensure that your data is clean, reliable, and scalable. Establishing governance ensures your tools deliver value rather than churning out expensive errors.

Common Challenges and How We Overcome Them

Data Quality and Governance

Ensuring high-quality input is vital because “garbage in, garbage out” is true. If your UTM parameters are messy or your tracking pixels are firing twice, your reports will be lies. We prioritize governance frameworks to ensure every byte of data entering your system is validated and clean.

Bridging the Gap Between Marketing and Tech

Communication bridges this gap to prevent friction, though marketing managers often speak of “campaigns” while data engineers speak of “pipelines.” Our role is to bridge that gap. We ensure that marketing requirements are translated into technical specs, and that technical constraints are communicated clearly to business stakeholders.

Data-mature companies don’t just happen by accident; they are built. And according to McKinsey, companies that effectively use data to drive growth outperform their peers by significant margins in both revenue and profitability.

Conclusion

Success in the future of marketing belongs to those who can blend the art of creativity with the science of data. Marketing analytics is not just a report card; it is the engine of your growth strategy. It allows you to move with confidence, proving valuable ROI to your stakeholders and delivering better experiences to your customers.

You don’t need to be a data scientist to be data-driven; you just need the right partner to help you build the infrastructure. Focus on the impact, not the volume of data, and treat your analytics as a strategic asset rather than a technical burden.

Ready to stop guessing and start knowing? Explore our marketing analytics services and let’s build your roadmap to data-driven growth today.

Frequently Asked Questions

1. What is the difference between marketing analytics and digital marketing analytics? Marketing analytics covers all marketing efforts, including offline channels (like TV or print) and their impact on sales. Digital marketing analytics specifically focuses on data from online channels like social media, search engines, and websites. In a modern unified view, these two should merge into one holistic system.

2. How do I measure ROI effectively without third-party cookies? Cookieless measurement relies on “aggregate” data rather than individual user tracking. Methods like Marketing Mix Modeling (MMM), which analyzes correlations between spend and revenue, and Incrementality Testing, which isolates the true lift of a campaign, are the gold standards for the privacy-first era.

3. Which KPIs should a small business focus on first? Start with the basics of efficiency and outcome: CPA (Cost Per Acquisition) to ensure you aren’t overspending for customers, and ROAS (Return on Ad Spend) to ensure your ads are generating revenue. As you mature, you can move to more complex metrics like CLV and Multi-Touch Attribution.

4. How long does it take to see results from a new analytics strategy? Building a data pipeline and cleaning historical data can take a few weeks to a few months, depending on complexity. However, once the “lights are turned on” and you have a unified view, actionable insights, like identifying wasted ad spend, can often be found in the first reporting cycle.

References

Article By:

https://stellans.io/wp-content/uploads/2026/01/1565080602204-1.jpeg
Zhenya Matus

Fractional CDO

Related Posts

    Get a Free Data Audit

    * You can attach up to 3 files, each up to 3MB, in doc, docx, pdf, ppt, or pptx format.