Modern Financial Modeling: Integrating ERP Data for Real-Time Forecasts

6 minutes to read
Get free consultation


It is the end of the month, and the finance team is operating at full capacity. You are reviewing the latest diverse CSV exports from sales, cross-referencing them with the bank feed, and hoping that the massive Excel workbook you just opened remains stable. This “End of Month” rush is a familiar routine for thousands of FP&A teams, and there are powerful ways to streamline it entirely.

The traditional approach to financial modeling, relying heavily on manual extracts, static spreadsheets, and email chains, is hitting a hard ceiling. As organizations scale, the limits of Excel for big data become painfully obvious. Version control requires constant attention, formulas need frequent updating, and the gap between what happened (actuals) and what we thought would happen (forecast) widens.

To achieve real-time accuracy and agility, modern finance leaders must start thinking less like traditional accountants and more like data engineers. The solution is a fundamental shift in architecture rather than just a better spreadsheet. It requires integrating ERP data directly into a Financial Data Warehouse to unlock the true potential of FP&A automation. At Stellans, we bridge this gap, helping you move from manual compilation to automated, strategic insight.

The Hidden Costs of Legacy Modeling

While Excel remains a powerful canvas for ad-hoc analysis, relying on it as a database for your entire financial organization creates hidden taxes on your team’s time and accuracy.

Escaping “Version Control Hell.”

One of the most persistent challenges in traditional financial modeling is identifying the final version. When models live in files saved on local drives or shared folders, keeping track of the single source of truth becomes a full-time job. You might have “Budget_v3_FINAL_updated.xlsx” circulating via email, while a regional manager works off “Budget_v3_FINAL.xlsx.”

This fragmentation leads to complicated version histories, where hours are spent reconciling conflicting numbers. Furthermore, it increases the risk of manual errors. A hard-coded number in one cell, an outdated VLOOKUP in another, or a missed row during a copy-paste operation can compound into significant reporting errors that compromise stakeholder trust.

The Speed Limit: Slow Close Cycles

Manual data entry and consolidation act as a speed limit on your organization’s agility. If your team takes two weeks to close the books to manually clean and stitch together data exports, your insights lose their immediate value by the time they reach the executive table.

Industry statistics often highlight that finance professionals spend up to 75% of their time gathering and cleaning data, leaving only 25% for high-value analysis. In a rapidly changing market, accelerating this process becomes a distinct competitive advantage. You need to know how a pricing change impacted margins yesterday, giving you immediate actionable insights. By automating the flow of financial modeling data, we reverse this ratio, empowering your team to spend their time analyzing the future rather than reconstructing the past.

Building the Foundation: The Financial Data Warehouse

To solve these challenges, we centralize our data assets in an environment known as a Data Warehouse. According to Oracle, a data warehouse is a type of data management system designed to enable and support business intelligence (BI) activities, particularly analytics. It is the repository where data from your ERP, CRM, and billing systems converges to create a Single Source of Truth.

Why You Need a Single Source of Truth

In a typical setup, revenue data lives in the ERP (like NetSuite or SAP), sales pipeline data lives in the CRM (like Salesforce), and cash flow data lives in the banking portal. These systems rarely talk to each other fluently out of the box. A Financial Data Warehouse brings all these disparate sources together into one unified schema.

By centralizing your data, you establish absolute clarity on correct figures. Everyone, from the CFO to the marketing director, looks at the same governed metrics. This foundation is critical for advanced analytics. You need a bedrock of clean, consolidated data to build durable predictive models.

The Role of Automated Pipelines

Once the destination (the warehouse) is defined, we construct the pathways. This is where automated data pipelines come in. Tools and custom APIs work tirelessly in the background to move financial modeling data from your source systems into the warehouse.

In this modern architecture, human interaction shifts directly to the highly impactful analysis stage. We set up pipelines that run effectively on their own:

  1. Extract raw data from the ERP and CRM APIs.
  2. Load it into the warehouse.
  3. Transform it using SQL comparisons and clean-up logic.

This process ensures that when your FP&A manager opens their dashboard in the morning, the data is fresh, reconciled, and ready for strategic questioning.

From Static to Dynamic: FP&A Automation in Practice

With a data warehouse in place, we can move beyond static reporting into dynamic, automated insights. This is where the role of the “CFO as Data Engineer” truly pays dividends.

Automating Actuals vs Budget Variance

Variance analysis is the heartbeat of financial control, and modern workflows transform it into a highly efficient process. In a modern setup, we automate Actuals vs Budget variance completely.

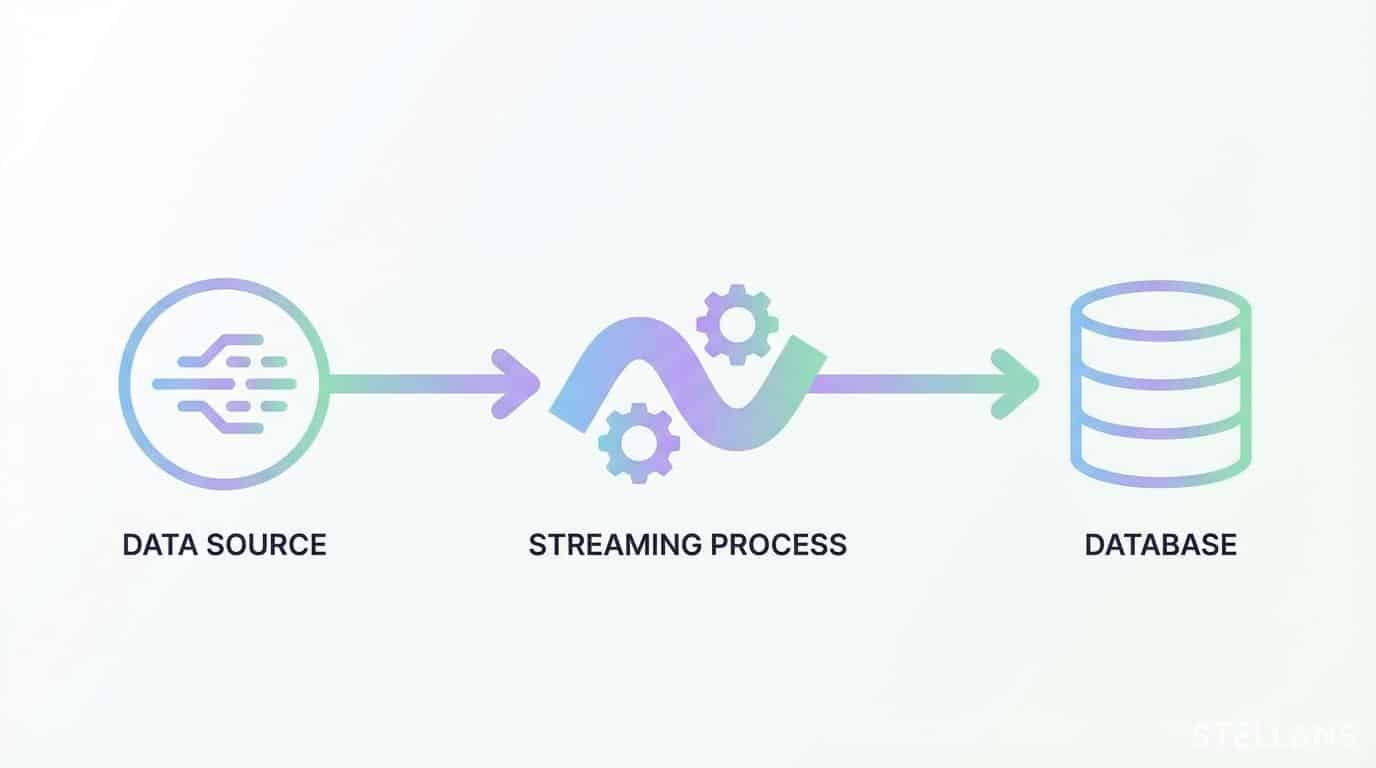
Your budget data (likely created in a planning tool or a governed Excel template) is loaded into the warehouse. Every night, the automated pipeline pulls the day’s actuals from the ERP. A transformation script then compares the two, calculating variances across cost centers, departments, and revenue lines.

The result is immediate visibility into your budget performance. Reliable dashboards update daily, flagging variances as they happen. This allows for immediate course correction and forward-thinking adjustments.

Advanced Scenario Planning with Python

Excel is fantastic, and complementing it with more robust tools expands your capabilities immensely. When you want to run Monte Carlo simulations or complex scenario planning on millions of rows of transaction data, specialized programming languages offer incredible stability. This is where we leverage the power of Python.

Python allows us to safely handle massive datasets and perform complex statistical modeling that would be difficult to manage in a spreadsheet. For example, asking “What happens to our cash runway if churn increases by 5% and we delay hiring by two months?” becomes an easily programmable query.

By using Advanced Data Science solutions, we can code these scenarios into flexible scripts.

This approach elevates scenario planning into a rigorous, data-driven science. For a deeper dive into how predictive models can enhance your planning, you might explore our work on Demand Forecasting with Prophet, which utilizes similar Python-based methodologies to predict market trends.

Real-Time Revenue Forecasting

Perhaps the most powerful application of this stack is real-time forecasting. By connecting your CRM directly to your financial model, you gain visibility into future cash flow based on the live sales pipeline.

Your connected model actively assesses the probability of each deal closing based on historical win rates and current stage duration, providing a continuously updated view of expected revenue. Implementing a Real-Time Reporting Dashboard allows the finance team to act as a responsive strategic radar for the business, identifying revenue opportunities weeks before they manifest.

Implementing the Shift: A Roadmap for CFOs

Transitioning to a modern data stack is a highly rewarding journey. At Stellans, we guide finance leaders through this transformation in structured phases.

Phase 1: Sanitation & Governance

High-quality data inputs ensure high-quality outputs. The first step focuses on ensuring your ERP and downstream data are pristine. This involves standardizing the chart of accounts, enforcing naming conventions, and establishing strong data governance. With proper governance, automation rapidly scales the creation of reliable insights. We help you design the protocols that keep your data exceptionally trustworthy. For organizations looking to formalize this, our Compliance services provide the framework necessary to ensure data integrity and regulatory adherence.

Phase 2: Architecture & Integration

Once the data is governed, we build highly efficient pipes. This is the engineering phase where we set up the data warehouse (e.g., Snowflake), configure the ELT tools (like Fivetran or Airbyte), and write the transformation logic. We treat your financial modeling data with the same rigor as critical software infrastructure to ensure it remains secure, redundant, and scalable.

Phase 3: The “Well-Oiled Machine.”

With the infrastructure live, your team shifts focus toward high-value strategy. The monthly close becomes a seamless event. Variance reports run automatically. Your analysts spend their days running Python scenarios to answer valuable “what-if” questions for the Board. The finance function successfully evolves from a traditional scoreboard keeper to a crucial strategic navigation system for the CEO.

Conclusion

The era of automated platforms has arrived. For the modern CFO, the ability to integrate ERP data for real-time forecasts is a strategic imperative and a crucial technical upgrade. By adopting data engineering principles, you unlock a remarkable new level of financial intelligence.

At Stellans, we build the bridge connecting traditional finance with modern data science. We engineer advanced predictive models along with the scalable systems that fuel them. Whether you want to unify data silos or implement advanced Python-based forecasting(https://stellans.io/services/), our team is ready to empower your transformation.

If you are ready to audit your current modeling infrastructure and build a roadmap for the future, visit our services page or contact us today. Let’s turn your data into your most valuable asset.

Frequently Asked Questions

1. What are the limits of Excel for big data financial modeling?
Excel provides an excellent starting point, but larger datasets require enterprise-grade databases to maintain rapid performance, stability, and stringent version control. Integrating specialized data systems ensures you can handle seamless real-time connections without interruption.

2. How does automating actuals vs budget variance work?
Automation involves setting up a data pipeline that extracts daily actuals from your ERP and compares them against budget data stored in a central data warehouse. Scripts run this comparison automatically (e.g., overnight), updating dashboards with the latest variance figures continuously.

3. Why use Python for financial scenario planning?
Python excels at handling large datasets and performing complex calculations like Monte Carlo simulations. It provides outstanding auditability through code versioning, exceptional processing speeds, and the remarkable ability to model complex, non-linear relationships.

4. What is a financial data warehouse?
A financial data warehouse is a centralized repository that consolidates data from various sources such as ERPs, CRMs, and bank feeds. It acts as a primary Single Source of Truth for an organization, enabling highly consistent reporting, historical analysis, and advanced data modeling.

References

Article By:

https://stellans.io/wp-content/uploads/2026/01/leadership-2.jpg
Anton Malyshev

Co-founder, COO at Stellans

Related Posts

    Get a Free Data Audit

    * You can attach up to 3 files, each up to 3MB, in doc, docx, pdf, ppt, or pptx format.